Definition:
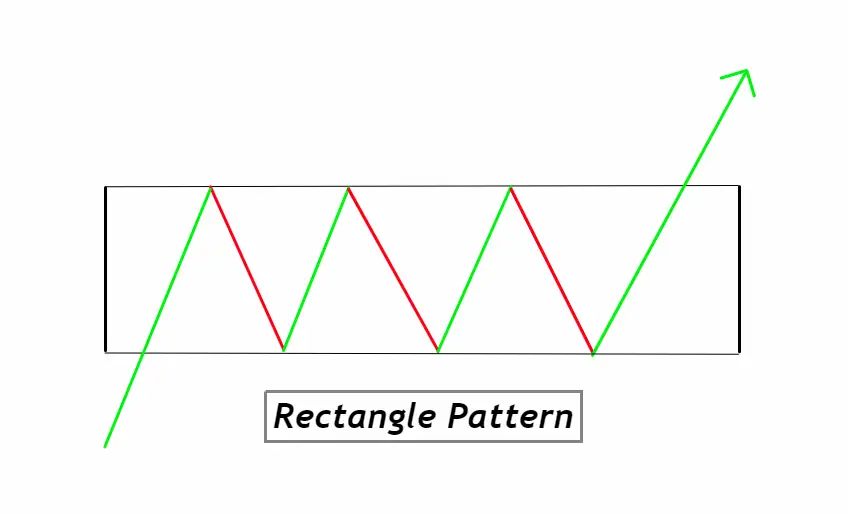
A Rectangle Pattern is a price formation on a chart characterized by two horizontal trendlines connecting multiple peaks and troughs, indicating a trading range where the price is moving sideways. Often observed in technical analysis, the Rectangle Pattern signifies a period of consolidation before the price either breaks out or breaks down, signaling potential continuation or reversal.
How to Identify a Rectangle Pattern on a Chart:
- Horizontal Trendlines: Look for two distinct horizontal trendlines – one connecting the highs (resistance) and the other connecting the lows (support) of the price movements.
- Multiple Touchpoints: Ensure that there are at least two peaks touching the resistance and two troughs touching the support. More touchpoints can strengthen the validity of the pattern.
- Similar Price Levels: The highs should be relatively equal in price, as should the lows, indicating a clear trading range.
- Volume Analysis: Typically, the trading volume diminishes as the pattern progresses. A noticeable increase in volume on a breakout or breakdown can confirm the pattern’s completion.
- Duration: The pattern can be short-term, spanning a few weeks, or long-term, lasting up to several months. A longer consolidation period might lead to a more significant price move post breakout/breakdown.
- Price Movement: Within the rectangle, the price should oscillate between the support and resistance levels, creating a clear sideways movement.
- Breakout/Breakdown: Be alert for a decisive candlestick closing outside the rectangle boundaries. This could indicate the potential future direction of the price movement.
Significance of the Rectangle Pattern:
- Consolidation Phase Indicator: At its core, the Rectangle Pattern represents a tug-of-war between buyers and sellers. This consolidation phase is a time when neither bullish nor bearish forces are dominant. For traders, identifying this phase is crucial, as it often precedes a significant price movement. Understanding that the market is in a consolidation phase helps traders stay patient and prepare for the eventual breakout or breakdown.
- Predictive Value: While no chart pattern offers guaranteed outcomes, the Rectangle Pattern is especially valued for its predictive nature. When the price breaks out of the rectangle, it can often move in that direction for a distance roughly equal to the height of the pattern. This gives traders a potential target to aim for, thereby aiding in setting profit targets or stop-loss levels.
- Risk Management Tool: The well-defined support and resistance levels in the Rectangle Pattern are a boon for risk management. Traders can place stop-loss orders just outside these boundaries. If the price moves contrary to a trader’s expectations after a breakout or breakdown, these stops help limit potential losses.
- Volume Confirmation: The Rectangle Pattern is not just about price action; volume plays a critical role. A breakout or breakdown accompanied by a surge in volume adds more weight to the move, offering traders higher confidence in their decisions. Recognizing this interplay between price and volume can significantly enhance a trader’s edge in the market.
In essence, for new traders, understanding the Rectangle Pattern is a step towards mastering the art of technical analysis. It not only aids in forecasting potential price directions but also offers tools for effective risk management.
Activity of Big Traders During the Formation of a Rectangle Pattern:
- Accumulation/Distribution: When a Rectangle Pattern emerges, one interpretation is that big institutional traders, often called “smart money”, are either accumulating (buying) or distributing (selling) their positions. The repeated tests of the resistance or support levels can be seen as these large players quietly building or offloading their positions without causing a significant price move.
- Low Profile Movements: Big traders aim to avoid causing significant ripples in the market, especially when they’re building substantial positions. The sideways movement in a Rectangle Pattern often masks the discreet and gradual activity of these institutional players. They strive to maintain the price within a specific range, ensuring they can accumulate or distribute at predictable prices.
- Breakout/Breakdown Dynamics: When the Rectangle Pattern completes, and a breakout or breakdown occurs, it’s often driven by a culmination of smart money positioning. If they’ve been accumulating, a breakout might happen as they finalize their positions, driving the price upwards. Conversely, if they’ve been distributing, a breakdown might ensue as they finish selling, driving prices lower. A significant spike in volume during the breakout/breakdown phase often confirms their involvement.
- False Breakouts: It’s essential to remain cautious, as institutional traders might occasionally engineer false breakouts or breakdowns to shake out weak hands or to trap traders on the wrong side of the trade. These false moves are often short-lived and reverse quickly, but they serve as a reminder that big players have the muscle to influence short-term price actions.
For retail traders, understanding the potential behavior of institutional traders during the formation of a Rectangle Pattern can offer a deeper insight into the market’s undercurrents. While the pattern itself provides valuable clues, the backdrop of big trader activity can further refine a retail trader’s strategy and approach, ensuring they’re aligned with, and not against, the market’s dominant forces.
Rectangle Pattern Confirmation Table:
| Confirmation Tool | Description and Usage |
|---|---|
| 1. Key Level Confluence | Check if the rectangle’s support and resistance levels align with other significant historical levels. The confluence of multiple levels enhances the pattern’s reliability. |
| 2. Break of Prior Low/High | After pattern formation, a break below a prior low suggests a likely downward continuation, while a break above a prior high indicates potential upward continuation. |
| 3. Volume Surge | A significant increase in volume on a breakout or breakdown provides added confidence in the move’s authenticity. High volume indicates strong institutional or trader interest. |
| 4. Technical Indicators | Employ momentum indicators like the RSI or MACD. For instance, a breakout accompanied by a bullish MACD crossover or RSI moving above 70 can reinforce the pattern’s validity. |
Utilizing this table as a guide, traders can increase the probability of successful trades by waiting for multiple confirmations before executing a trading strategy based on the Rectangle Pattern. It’s always advisable to seek multiple confirmations to filter out potential false signals and improve the trade’s risk-to-reward ratio.
Trading the Rectangle Pattern: Essential Insights
Best Timeframe: For swing traders, the daily and 4-hour charts offer the most reliable signals, balancing clarity with significant price moves. However, intraday traders can also find success on the 1-hour or 15-minute charts, though they may encounter more false signals.
Trading Session: The pattern’s reliability tends to be higher during the primary trading hours of the relevant market (e.g., the first few hours after the opening bell for stock markets or during London and New York overlap hours for the forex market).
Winning Ratio: While the Rectangle Pattern is a powerful tool, it’s essential to remember that no pattern guarantees success. With proper risk management and confirmation signals, traders might achieve a winning ratio of around 60-70%, but this can vary based on individual strategy and market conditions. Always backtest and validate the approach in real-time conditions.
Rectangle Pattern Trading Strategy with Confluence:
- Entry:
- Bullish Breakout: Enter a long position when the price closes above the rectangle’s resistance with significant volume.
- Bearish Breakout: Enter a short position when the price closes below the rectangle’s support with similar volume confirmation.
- Stop-Loss:
- Bullish Breakout: Place a stop-loss just below the rectangle’s resistance-turned-support or the last significant low inside the rectangle.
- Bearish Breakout: Position a stop-loss just above the rectangle’s support-turned-resistance or the last significant high inside the rectangle.
- Take Profit:
- The height of the rectangle can provide a projection for the potential price move. For example, if the rectangle is 50 pips tall, aim for a 50-pip move after the breakout or breakdown.
- Alternatively, if using confluence, you might set your take profit at the next significant support or resistance level, or where other technical indicators suggest a potential reversal.
Conclusion:
The Rectangle Pattern is a versatile chart pattern that highlights periods of consolidation in the market. For traders, it offers clear boundaries for decision-making and, when combined with confluence factors, can lead to high-probability trades. As with all strategies, it’s crucial to practice sound risk management and continuously review and refine your approach based on real-time results and market conditions.

