Definition
The rally base rally is a supply and demand pattern in which a demand zone forms due to two bullish impulsive waves and a retracement wave. Institutional traders and banks place pending buy orders at the demand zone. After filling these pending orders, the market continues its bullish trend.
RBR also denotes rally base rally in trading. It is a price action term and is widely used by retail traders to identify the footprints of market makers.
One thing you must know before reading this article is that you can profit from the market only by following the way of big banks or market makers because they drive the market. If you follow the way of retail traders, you will always lose in this market.
How to find rally base rally pattern in forex?
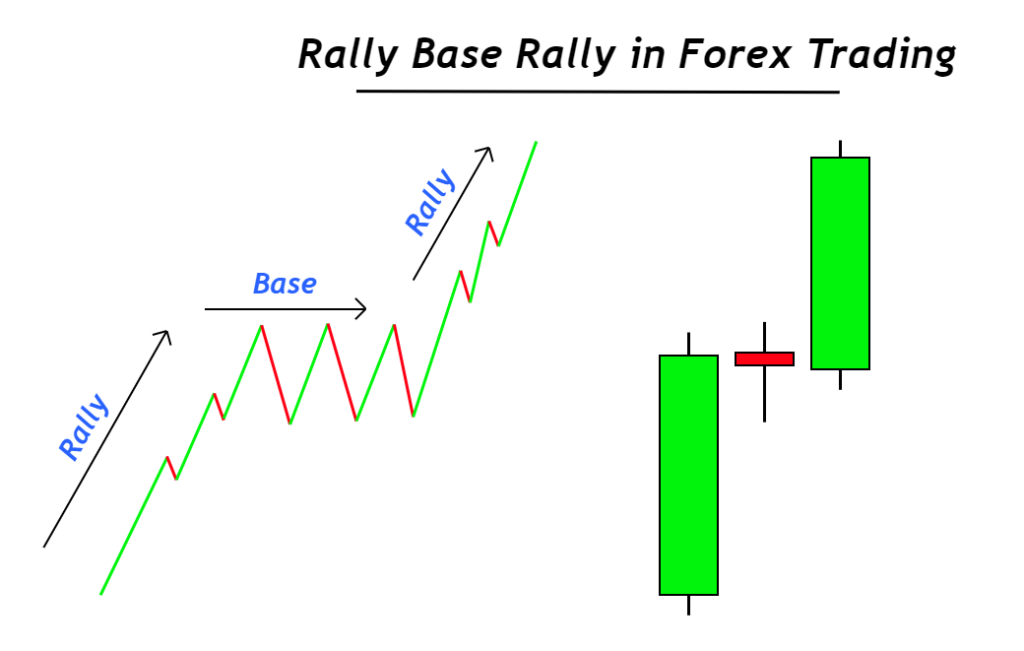
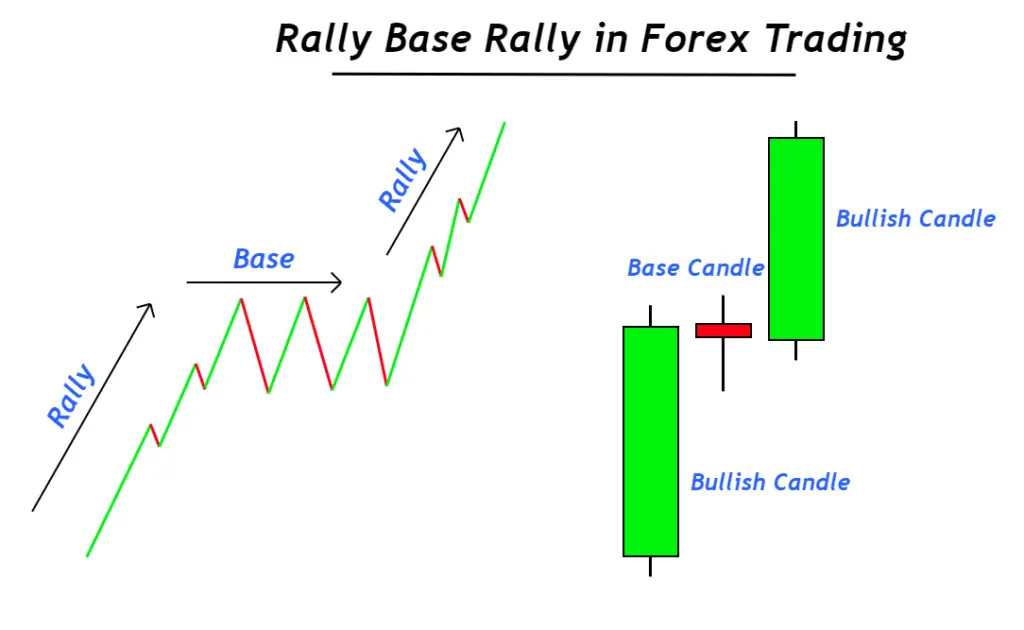
On the candlestick chart, the rally base rally pattern consists of two big bullish candlesticks and one or more base candlesticks—the base candle sandwich between the two big bullish candlesticks to make a rally base rally pattern.
There are specific requirements that you should follow to identify the perfect RBR pattern in the market:
- Big bullish candlestick: The body-to-wick percentage of a big candlestick should be greater than 60%. Because this candlestick refers to a bullish impulsive wave on the price chart.
- Base candlestick: The body-to-wick ratio of the candlestick should be small, like a doji candlestick. Simple candlesticks with bigger wicks/shadows and small body size. Base candle refers to the ranging market structure on the price chart.
A rally base rally pattern forms when these three candlestick patterns form in a specific sequence. The sequence is the following:
Big bullish candlestick, Base candlesticks, Big bullish candlestick
Look at the image below to better understand this supply and demand pattern.
How to draw demand zones using rally base rally in trading?
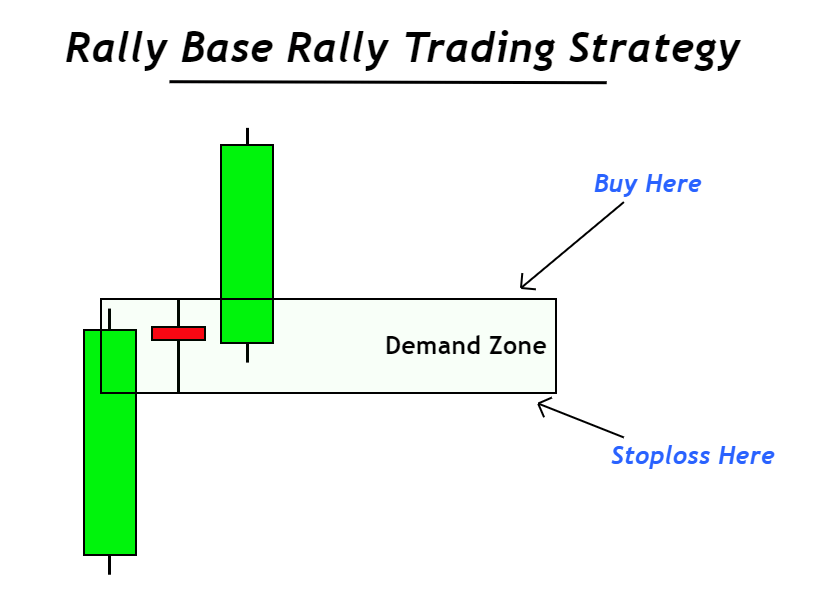
Demand zones are the areas on the price chart that talk about the presence of institutional pending orders in a specific price range. It is not an exact price, but it is a price range. The base candlesticks help to draw the zone.
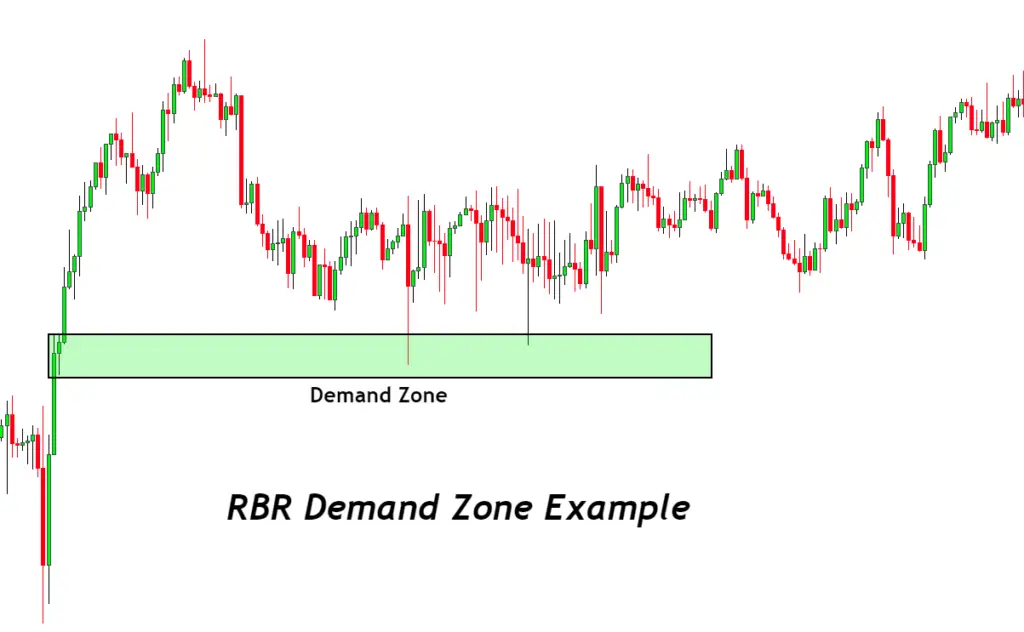
The high and low prices of base candlesticks will be used to draw a demand zone. Connect the high and low prices with a rectangle and extend the rectangle to the right on the price chart. This zone will act as a demand zone.
There are two more requirements for a perfect zone:
- If the last big bullish candlestick’s low is lower than the base candles, you should use the lower point to draw the zone.
- If the first big bullish candlestick’s high is higher than the base candle’s high price, you should use the higher price to draw the zone.
These two points are essential because sometimes the price will not pick your order due to minor differences in the zone. You should follow the above guidelines to get the perfect trade setup.

You can also check this Supply & Demand Indicator that draws real-time zones with great accuracy
What does the rally base rally pattern tell traders?
Rally base rally is one of the four supply and demand zone types in technical analysis. This pattern tells retail traders that the banks and institutions are ready to create a new bullish trend. To create a new trend, they will place pending buy orders at the demand zone.
When price comes to the demand zone, then orders of institutions and big banks will be filled, and price demand will increase. As a result, the price will increase, and a bullish trend will start.
From another point of view, a rally base rally is also a natural pattern like a spring or rarefaction/compression of waves in nature. The same is the case for the market. It progresses in the form of compression and rarefactions. These natural patterns repeat with time, and you should analyze these price patterns.
Note: Price always moves from one range to another in the form of impulsive waves.
Also, learn about FTR and FTB in forex
How to trade Rally base Rally?
Trading the RBR pattern is very simple, but you can use other technical tools like a higher timeframe to increase the probability of winning. The best part of trading supply and demand zones is that they offer very high-risk reward ratios.
Pending buy order
Open a pending buy order a few pips above the high of demand zone. Make sure to cover the spread while placing an order. Place the stop loss a few pips below the low of the demand zone. When the price returns to the demand zone, the buy order will be filled.
The drawback of the demand zone is that it does not tell us about the take profit levels, so you will have to use other technical tools like chart patterns to fix take profit levels.
The trading demand zone is always done with pending orders. It would be best if you did not prefer instant market orders due to pinpoint entries, and you will miss some trades.
The Bottom line
The most basic price action pattern is supply and demand. Supply and demand are driving forces of every market in the world. So, you should try to learn it before any other technical pattern because learning supply-demand will substantially improve your trading performance.
You should also try this indicator to get the full power of supply and demand zones trading.

