Definition
The drop base rally is a price action pattern that forecasts the formation of a demand zone on the price chart. This demand zone indicates the presence of buyers at a specific price range. DBR denotes it.
Retail traders use this price range to find institutional buy orders. Then they also follow the instructions in the buy direction to gain more profit. This is the way the top 1% of retail traders follow the institutions instead of trading against them. The trend is your friend, and trend following is the method of big traders.
In this article, you’ll learn about the drop base rally, a supply and demand trading type. After reading this article, you’ll be able to draw a demand zone on the price chart.
How to identify a drop base rally?
There are two methods to find a Drop base rally pattern on the candlestick chart.
- In the first method, we’ll use candlesticks to find the DBR pattern
- In the second method, we’ll analyze the price waves to find the DBR pattern
The first method is the most accurate; beginner traders will also find it easy to understand. However, if you’re an experienced trader, you must learn the second method to dive deep into supply and demand trading.
Using candlesticks to find the DBR pattern
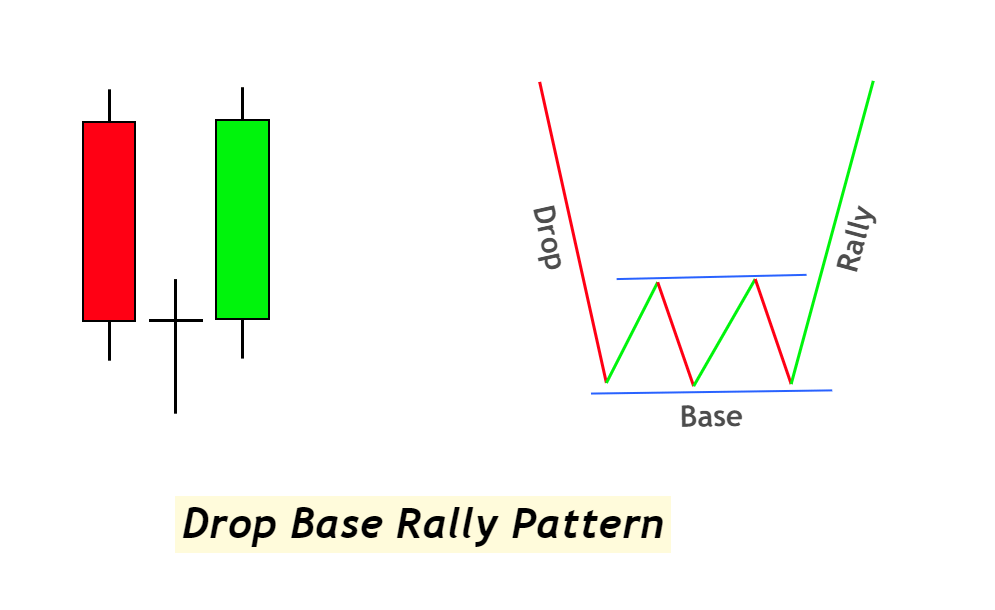
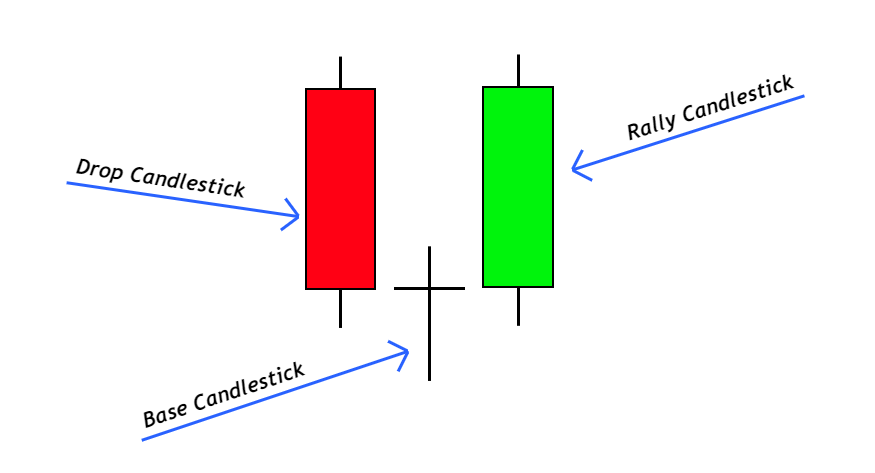
In this method, Drop represents the big bearish candlestick, Base represents the small doji candlestick with large wicks, and rally indicates the bullish candlestick. This will form a drop-base rally pattern.
The candlesticks must form in the following sequence:
Big bearish candlestick + Doji or small candlestick + big bullish candlestick
A vital step to remember is that the Base can contain more than one small candlestick. The number of candlesticks in the base region is inversely proportional to the strength of the demand zone. It means a base zone with three doji candlesticks will be weak compared to a base zone with one doji candlestick.
Pro tip: You should only identify the Base with up to three doji candlesticks.
Price wave method
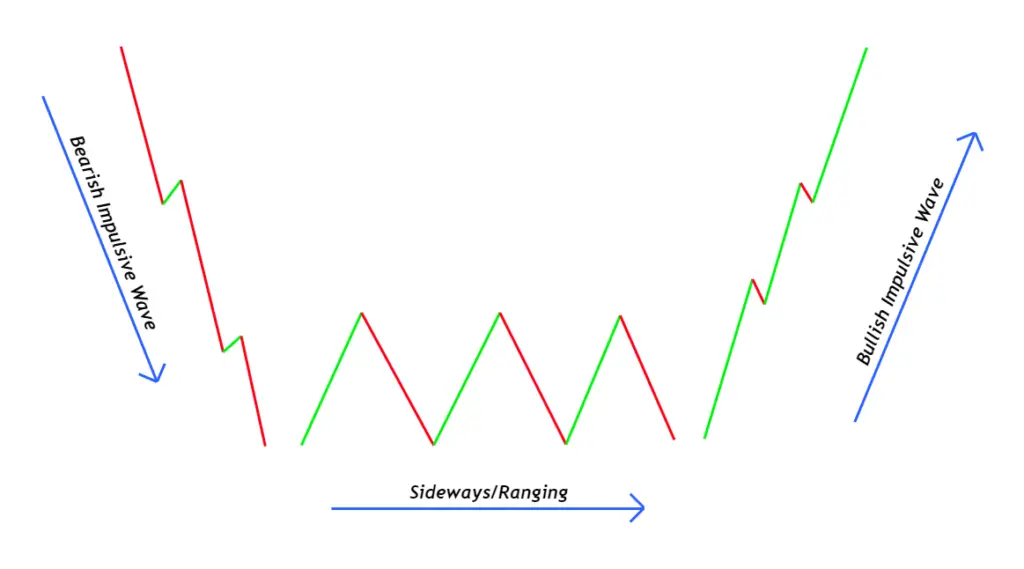
In this method, the Drop represents a big bearish price wave. Kindly remember that both methods ( candlestick and wave) have the same sense on the backend. The difference is only in the identification on the price chart.
After the bearish wave, the price will turn its direction into a sideways or ranging structure. This will represent the base region. After a sideways market, the price will break in the bullish direction, and a big impulsive wave will form. This bullish impulsive wave will represent a rally in the Drop base rally pattern.
If you don’t know about the impulsive and retracement waves, then click here to learn.
How to draw the demand zone in the drop-base rally pattern?
In drawing the demand zone, the limits of the base region are essential.
When we identify the DBR using the candlesticks, we’ll use the limits of small candlesticks to draw the zone. So draw the rectangle using the high and low of the small candlestick and extend the zone to the right. This zone will be a demand zone, indicating that institutional buyers will buy from this price range.
On the other hand, when we identify the DBR pattern by price waves, the sideways price range limits are used. So draw a rectangle using the highest high and lowest low of ranging market during DBR formation and extend that rectangle to the right. This price range will act as a Demand zone.
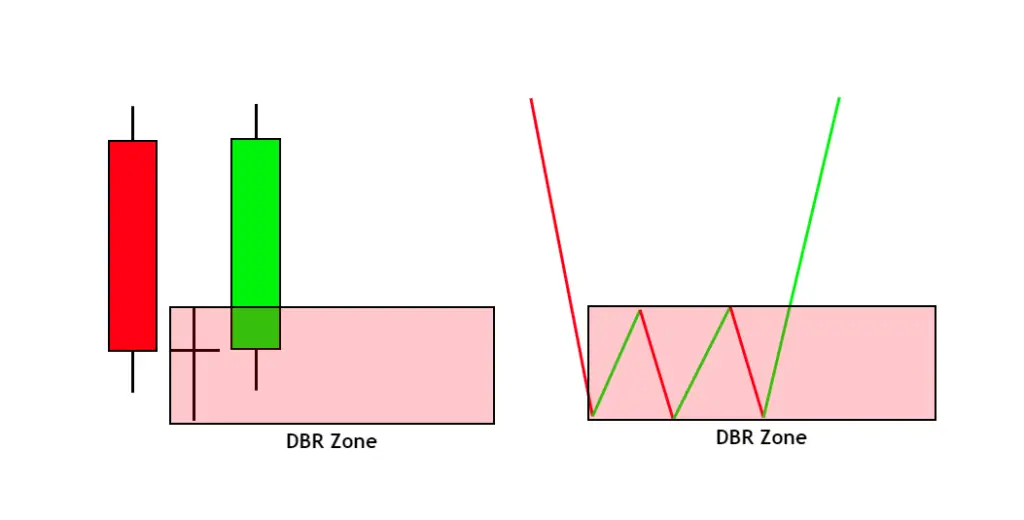
Remember that you should draw the rectangle only after the Drop base rally pattern is completed.
What does the DBR pattern tell traders?
The most straightforward answer to this question is that the Drop base rally pattern gives price action traders a small price range that indicates the presence of buy orders of institutional traders.
Unlike the other three patterns in supply and demand trading, a drop base rally is a natural pattern. Advanced traders determine the activity of institutions and banks using the patterns of candlesticks. This is the real price reading, and price reading is the method of top traders.
How to trade the drop base rally pattern?
Trading the demand zone created by the drop base rally pattern is very simple and straightforward. Supply zone shows the accumulation of market buy orders at a specific area. So when a DBR pattern will form then open buy limit orders at the high of the zone and place the stop loss a few pips below the low of demand zone.
When price will come to the demand zone then buy limit orders will fill automatically.

The bottom line
My first recommendation is that you must learn to read the price on the chart. It will help you find or determine market makers’ next move. In the end, you’ll be able to ride a trend from the start.
You’ll be unable to predict the market maker’s move 100% accurately. But here comes risk management. So using risk management and price reading, you can become the top 1% trader.

