Definition
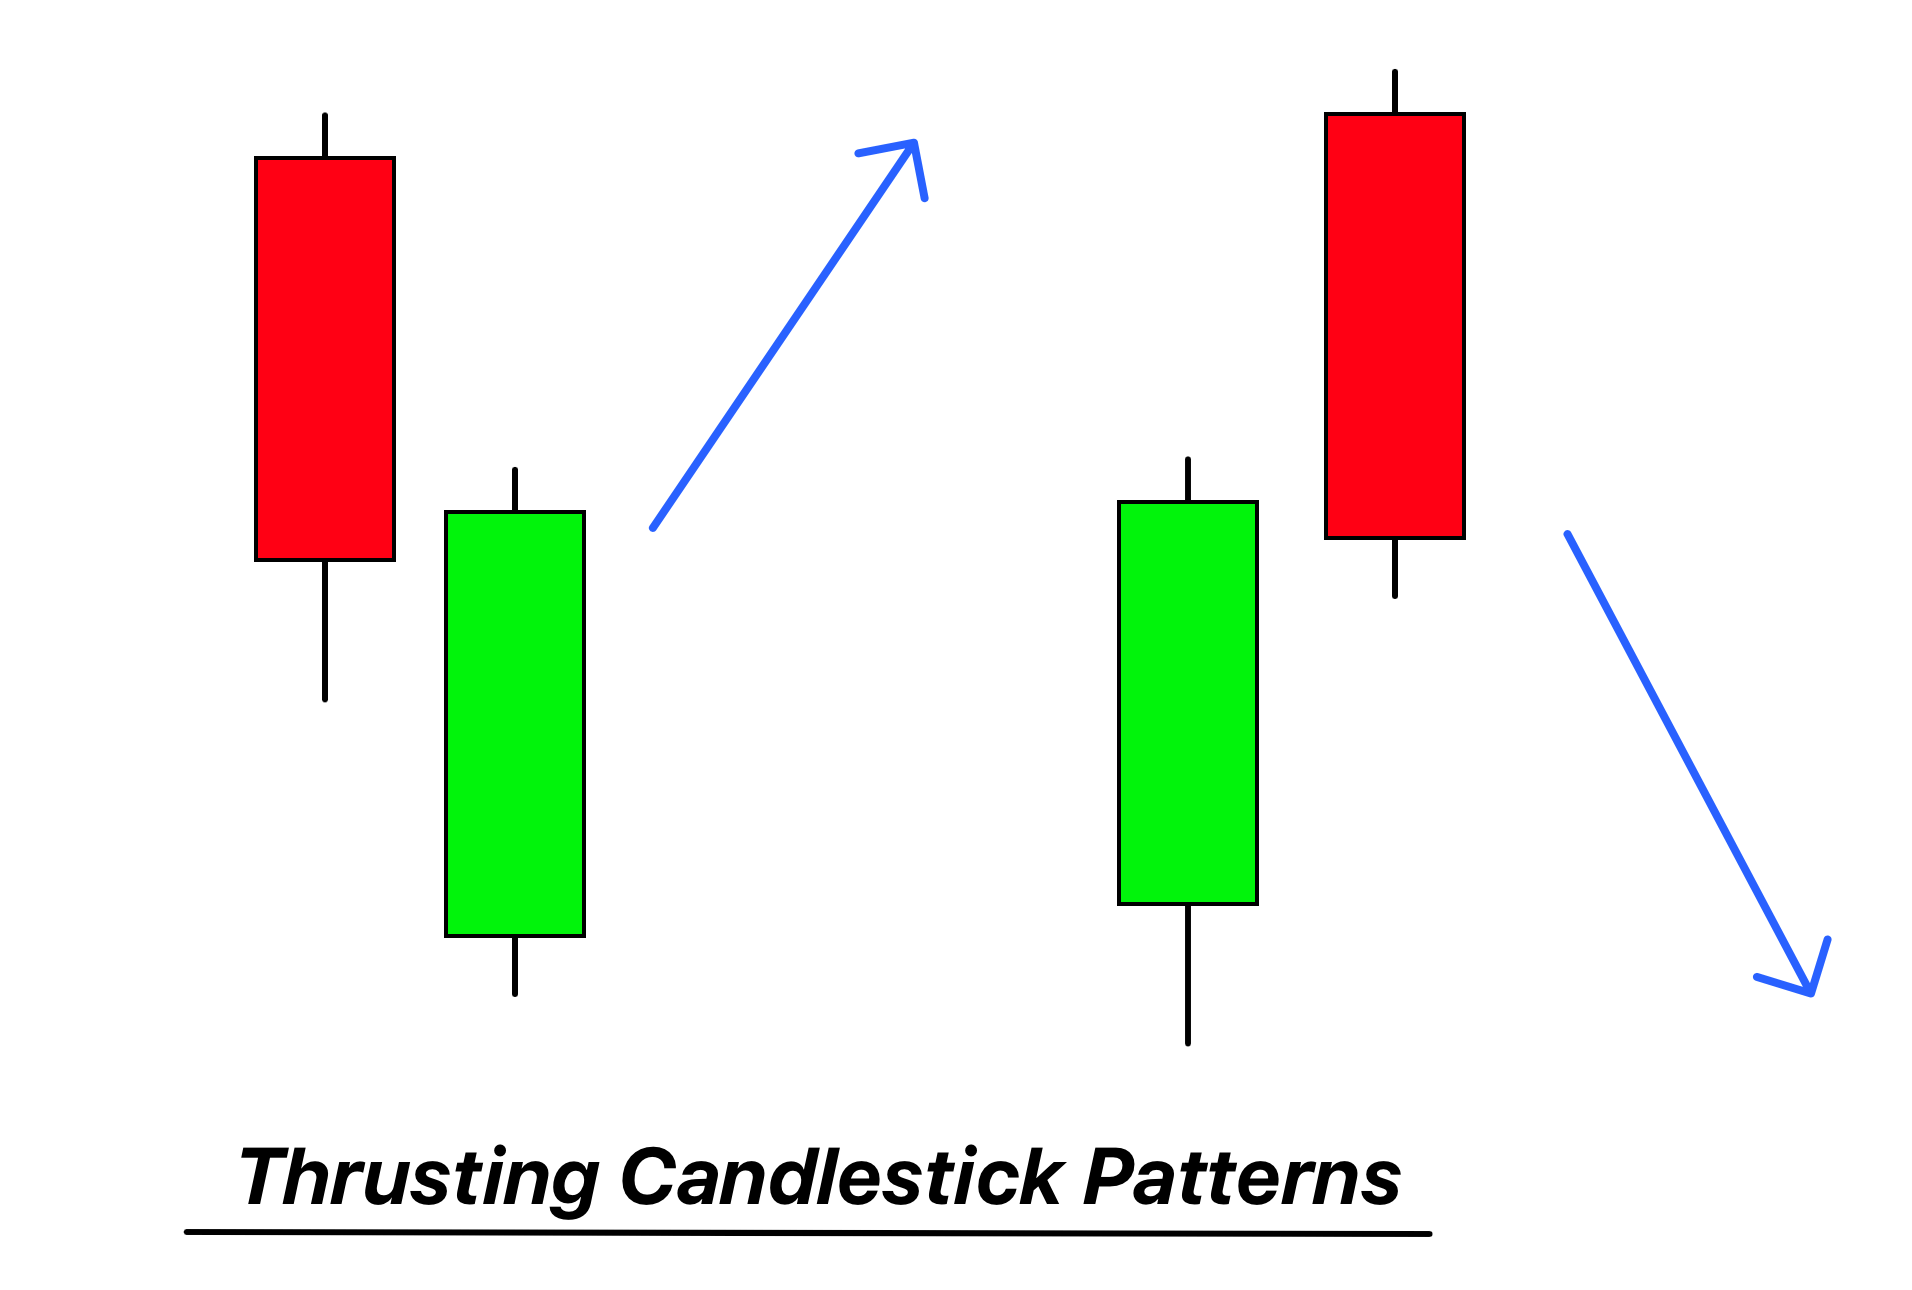
A Thrusting Candlestick Pattern is a two-day bearish reversal pattern where a small-bodied candle follows a long bullish candle, but the second day’s close remains above the midpoint of the prior day’s body.
Often seen in uptrends, the Thrusting Candlestick Pattern signals potential weakness in the prevailing momentum, suggesting traders to be cautious of a potential trend reversal.
How to Identify the Thrusting Candlestick Pattern on a Chart:
- Uptrend Precedence: Begin by ensuring the pattern is forming during an uptrend. This context is essential for the pattern’s bearish reversal implication.
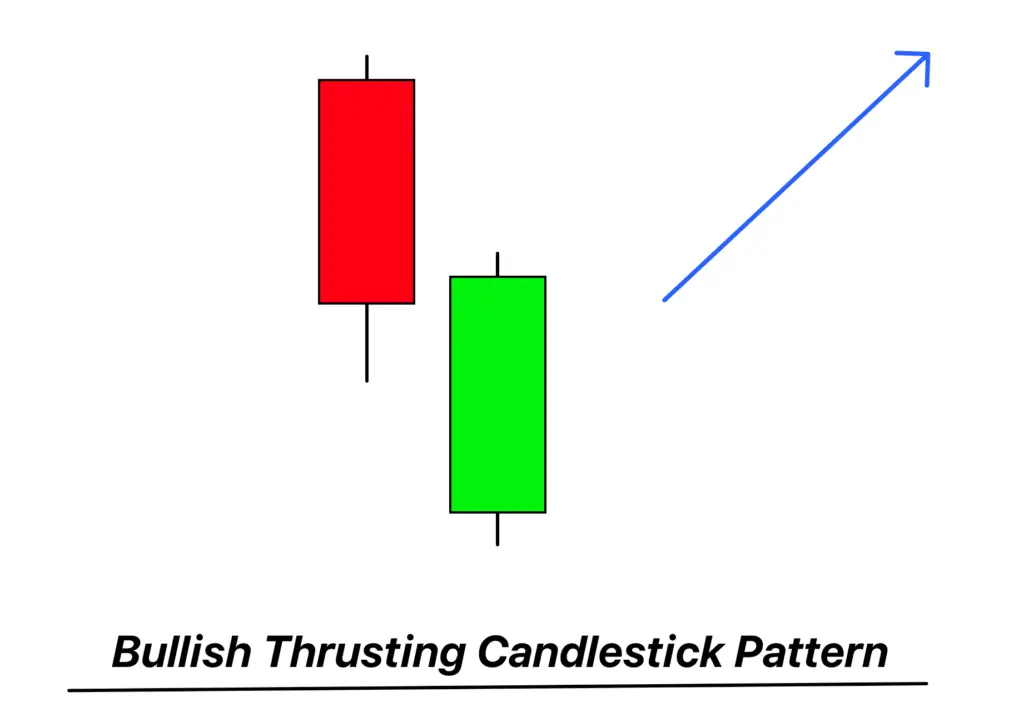
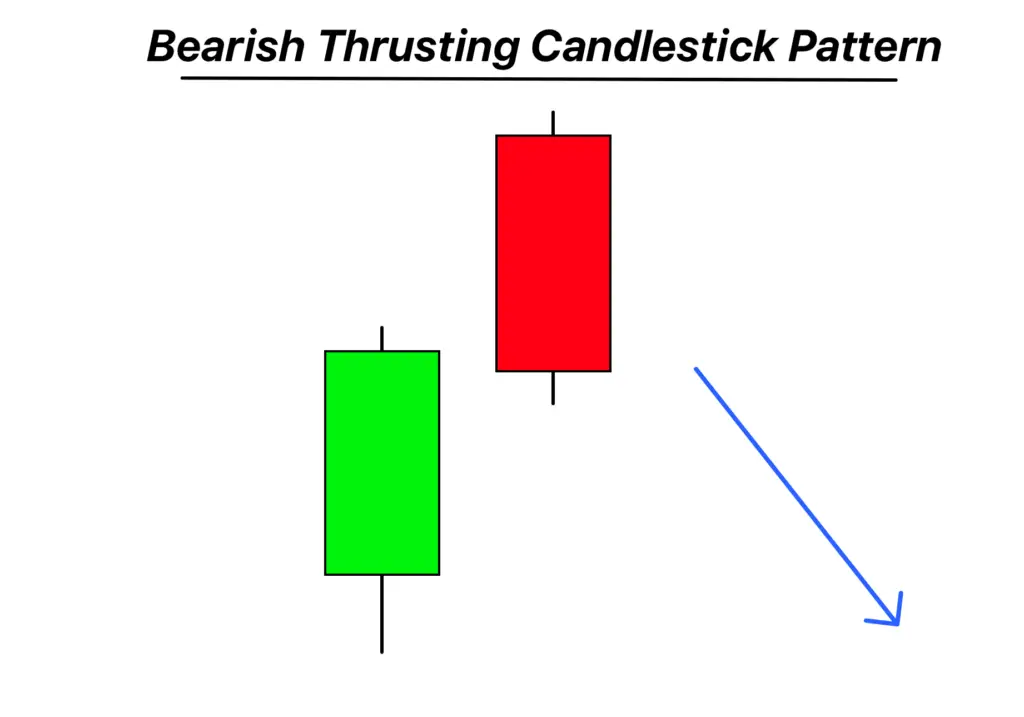
- First Candle Characteristics: The first candle should be a long bullish (green or white) candle, indicating a strong upward move.
- Second Candle Opening: The second candle should open below the close of the first candle, indicating a gap down.
- Second Candle Body: The body of the second candle should be smaller than the first. It can be either bullish (green or white) or bearish (red or black).
- Second Candle Close: Crucially, the second candle should close above the midpoint of the first candle’s body but below its close. This indicates that the bears tried to push the price down but couldn’t maintain full control.
- Volume Consideration: While not mandatory, higher trading volume on the second day can add validity to the pattern, suggesting a stronger shift in sentiment.
By following these points, traders can systematically identify the Thrusting Candlestick Pattern on their charts.
Significance and Indications
- Momentum Shift: The Thrusting Pattern indicates a potential shift in momentum from bullish to bearish. While the prevailing trend is upward, the appearance of this pattern suggests that the bulls might be losing their grip.
- Bearish Warning: While it’s not as strong a reversal signal as other patterns like the Bearish Engulfing or Dark Cloud Cover, the Thrusting Pattern serves as a warning. It tells traders that the bears are starting to show resistance, and a trend reversal or consolidation might be on the horizon.
- Confirmation is Key: Professional traders often wait for further confirmation before acting on this pattern. This could be in the form of another bearish candlestick pattern, a break below a significant support level, or technical indicators signaling a downturn.
- Risk Management: The pattern’s appearance is a cue for traders to possibly tighten stop-loss orders or consider taking partial profits if they’re in a long position. It’s a reminder that the market sentiment might be shifting, and it’s essential to protect one’s position.
- Volume Insight: If the Thrusting Pattern is accompanied by increased volume, especially on the second day, it adds weight to the bearish reversal indication. A surge in volume shows a heightened interest in selling, reinforcing the pattern’s warning.
- Contextual Analysis: As with all candlestick patterns, the Thrusting Pattern should be analyzed in the context of other chart patterns, support and resistance levels, and technical indicators. A holistic approach ensures traders aren’t relying on a single signal but are considering the broader market dynamics.
In essence, the Thrusting Candlestick Pattern serves as a cautionary tale for traders, signaling potential weakness in an uptrend and prompting a reevaluation of current positions and strategies.
Activity of Big Traders During the Formation of the Thrusting Candlestick Pattern:
- Position Lightening: Institutional or big traders might start to lighten their long positions when they spot this pattern. This doesn’t necessarily mean they’re going full bearish, but they might be taking some profits off the table, anticipating a potential pullback or consolidation.
- Hedging Activities: Big traders often have hedging strategies in place. Upon seeing the Thrusting Pattern, they might initiate or increase their hedges, using options or other derivatives, to protect their portfolios from potential downside.
- Volume Analysis: A sudden spike in volume during the formation of this pattern can indicate active participation by institutional traders. If the volume is significantly higher, especially on the second day of the pattern, it might suggest that big traders are actively selling or reducing their exposure.
- Order Flow: Using tools like Level 2 or Time & Sales can give insights into the order flow. Large block trades or a series of significant sell orders might indicate institutional activity, signaling their sentiment.
- Liquidity Utilization: Big traders move the markets not just by their decisions but by the sheer volume of their trades. When they act, they often seek liquidity pockets to avoid slippage. If the Thrusting Pattern forms near significant support levels, and those levels subsequently break with increased volume, it can be an indication that big traders are pushing the price down.
- Sentiment Indicators: Tools like the Commitment of Traders (COT) report can provide insights into the positions of large speculators. If there’s a shift towards a more bearish stance by these traders around the time the Thrusting Pattern forms, it can be a corroborative signal.
- Contrarian Approach: Some institutional traders might use the formation of such patterns as an opportunity to go against the grain, especially if other fundamental or macroeconomic factors support a bullish view. Retail traders should be aware that not all big traders will interpret or act on the pattern in the same way.
For retail traders, understanding the potential actions and strategies of big traders when the Thrusting Candlestick Pattern forms can offer a competitive edge. It’s about reading the “footprints” of institutional activity and aligning one’s strategy accordingly, always keeping risk management at the forefront.
Confirmation Tools for the Thrusting Candlestick Pattern: High Probability Setups
| Tool/Indicator | Description |
|---|---|
| Key Support/Resistance Levels | If the pattern forms near a significant support or resistance level, it adds weight to its validity. A break below a support after the pattern’s formation can be a strong bearish confirmation. |
| Break of Low After Pattern Formation | A break below the low of the Thrusting Pattern, especially the second candle’s low, can indicate a strong bearish momentum and confirm the pattern’s reversal implication. |
| Volume Analysis | An increase in volume, particularly on the second day of the pattern, suggests heightened selling interest. High volume on a subsequent bearish candle can further confirm the pattern’s bearish bias. |
| Technical Indicators (e.g., RSI, MACD) | Indicators showing overbought conditions or bearish divergences can reinforce the pattern’s bearish reversal signal. For instance, if RSI is above 70 (overbought) and starts to turn down, it can be a confirming sign. |
Using these tools in conjunction with the Thrusting Candlestick Pattern can help traders identify high probability setups and make more informed trading decisions.
Optimal Conditions:
Best Timeframe: Daily charts offer the most reliable signals for the Thrusting Pattern, balancing clarity with significant price moves.
Trading Session: The pattern is most effective during the main trading hours of the respective market (e.g., 9:30 AM – 4:00 PM EST for U.S. stocks), as this is when the majority of institutional activity occurs.
Winning Ratio: While dependent on various factors, a well-executed Thrusting Pattern strategy can yield a winning ratio of approximately 55-65%. However, it’s crucial to combine it with other confirmatory tools for optimal results.
Trading Strategy with Confluence for the Thrusting Candlestick:
1. Entry: Wait for a third candle after the Thrusting Pattern. If this candle breaks below the low of the second candle (of the Thrusting Pattern) and there’s confluence with other bearish signals (e.g., technical indicators or key support break), this can be your entry point.
2. Stop-Loss: Place the stop-loss slightly above the high of the second candle of the Thrusting Pattern. This ensures that if the pattern fails and the price moves upwards, you’re protected from significant losses.
3. Take Profit: A simple approach is to target a risk-reward ratio of at least 1:2. If your stop-loss is 10 pips above your entry, aim for a take profit 20 pips below your entry. Alternatively, you can set your take profit at the next significant support level.
4. Confluence Factors: Always look for additional bearish signals to confirm the pattern:
- Technical indicators like a bearish MACD crossover or RSI moving below 50.
- A significant increase in volume on the bearish breakout.
- The pattern forming at significant resistance levels or other chart patterns.
Conclusion:
The Thrusting Candlestick Pattern, while a valuable tool, should not be traded in isolation. Its strength lies in its ability to signal potential trend reversals, but for higher probability trades, it’s essential to combine it with other technical tools and confluence factors. Proper risk management, including setting appropriate stop-loss and take-profit levels, is crucial to ensure trading success with this pattern.

