What are Pivot Points?
The Foundation of Forex Market Analysis
Pivot Points are a premier tool in Forex trading, essential for analyzing market trends and price movements. They serve as significant levels traders use to determine market direction, potential support and resistance areas, and possible turning points in price action. Calculated using the previous trading session’s high, low, and close prices, Pivot Points offer a predictive indicator of market sentiment, guiding traders in making strategic entry and exit decisions.
Decoding Market Movements with Precision
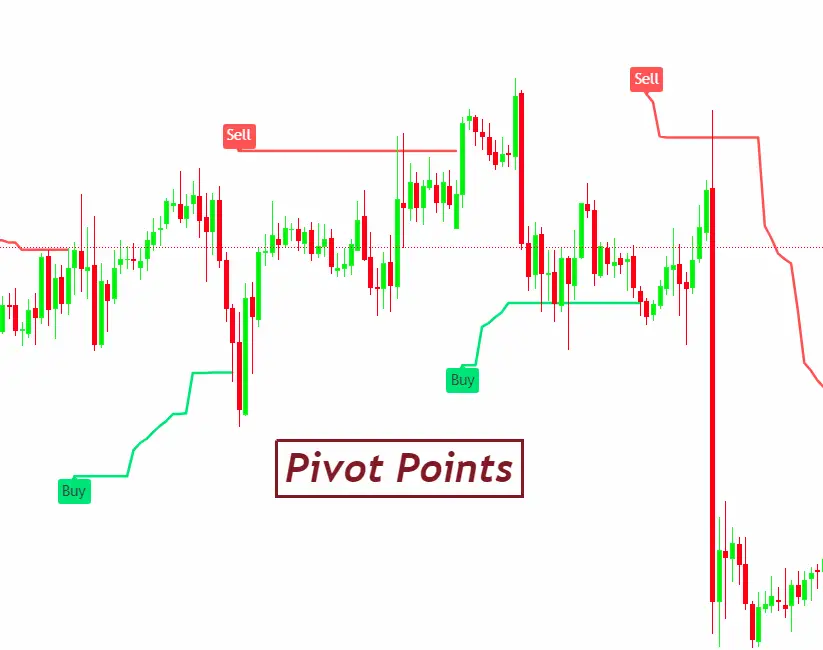
At their core, Pivot Points map out the battleground where buyers and sellers vie for control. The central pivot point, the heart of this indicator, sets the tone for the day’s trading sentiment. Prices above this level suggest bullish dominance, while those below signal bearish trends. Surrounding this central point are multiple support and resistance levels, each acting as potential barriers or targets for price movements. These levels allow traders to anticipate market behavior, providing a structured approach to navigating the Forex market’s ebbs and flows.
A Versatile Tool for Diverse Strategies
Pivot Points adapt to various trading styles, from day trading to swing trading, offering a versatile framework for market analysis. Their predictive nature and straightforward calculation make them a favorite among traders seeking clarity in the often turbulent Forex market. By integrating Pivot Points into their trading arsenal, traders arm themselves with a deeper understanding of market dynamics, empowering them to make more informed and strategic trading decisions.
Why Pivot Points Matter in Forex Trading
Navigating Market Volatility with Confidence
Pivot Points are indispensable in Forex trading for their unique ability to provide clear, actionable insights in a market known for its volatility. They offer traders a lens through which to view the market, distilling complex price movements into understandable levels of support and resistance. This clarity is crucial in making quick, informed decisions in a fast-paced environment.
Strategic Decision-Making with Predictive Indicators
The predictive nature of Pivot Points sets them apart. Unlike many indicators that lag, Pivot Points forecast potential market movements, giving traders a heads-up on future price levels. This foresight enables traders to plan their trades proactively, setting precise entry and exit points and managing risk more effectively.
Enhancing Risk Management
Effective risk management is the backbone of successful trading. Pivot Points contribute significantly by identifying critical price levels where market sentiment could shift. Traders use these levels to set stop-loss orders or to determine positions, minimizing potential losses and locking in profits.
Adaptable to Various Trading Styles
Whether you’re a day trader looking for quick wins or a swing trader seeking longer-term trends, Pivot Points adapt seamlessly to different trading approaches. Their versatility allows traders to tailor their strategies to their trading style and market conditions, enhancing the potential for success.
Complementing Other Trading Tools
Pivot Points don’t operate in isolation. They work best when combined with other indicators and analysis techniques, providing a comprehensive view of the market. This synergy enhances the reliability of trading signals, leading to more informed and confident trading decisions.
How to Calculate Pivot Points
Simplifying Market Analysis with Basic Formulas
Calculating Pivot Points is straightforward, relying on just three key prices from the previous trading session: the high (H), low (L), and close (C). The central pivot point (P) forms the core of this calculation, serving as the foundation for further analysis.
Central Pivot Point – The Core of Your Strategy
To find the central pivot point, use this simple formula:
3P=3(H+L+C)
This average of the high, low, and close prices sets the stage for determining subsequent support and resistance levels, essential for planning your trading day.
Building on the Foundation – Support and Resistance Levels
With the central pivot point established, you can calculate additional levels that are crucial for understanding potential market movements:
- First Level Support and Resistance:
- Resistance 1 (R1): 2 x P−L
- Support 1 (S1): 2×P−H
- Second Level Support and Resistance:
- Resistance 2 (R2): P+(R1−S1)
- Support 2 (S2): P−(R1−S1)
- Extending the Range – Third Level Support and Resistance:
- Resistance 3 (R3): H+2×(P−L)
- Support 3 (S3): L−2×(H−P)
Applying the Calculations to Your Trading
These calculated levels provide a roadmap for the trading day, indicating where price movements may hesitate or reverse. By understanding these levels, traders can set strategic entry and exit points, manage their risk, and anticipate potential market shifts.
Types of Pivot Points
Exploring the Diversity of Pivot Point Calculations
Pivot Points come in various forms, each offering unique insights and catering to different trading preferences. Beyond the standard calculation, traders explore other types to enhance their market analysis. Let’s delve into the most popular types:
1. Standard Pivot Points
The backbone of Pivot Point analysis, Standard Pivot Points, rely on the basic formula mentioned earlier. They serve as the starting point for many traders due to their simplicity and effectiveness in identifying key support and resistance levels.
2. Fibonacci Pivot Points
Incorporating the renowned Fibonacci sequence, these Pivot Points intertwine market psychology with mathematical precision. The calculation adjusts the standard model by applying Fibonacci ratios (such as 0.382, 0.618, and 1.618) to define support and resistance levels, offering a nuanced view of potential market movements.
- Calculation Insight:
- Resistance and support levels are derived by multiplying the range (high-low) with Fibonacci ratios and then adding or subtracting the result from the base pivot point.
3. Camarilla Pivot Points
Favored for their precision in day trading, Camarilla Pivot Points introduce a unique formula that emphasizes the close price and produces eight levels – four supports (S1 to S4) and four resistances (R1 to R4). These levels are renowned for their accuracy in pinpointing intraday turning points.
- Key Feature:
- The calculation places a heavier weight on the previous day’s close, providing a tight range that’s particularly useful for short-term, high-frequency trading strategies.
4. Woodie’s Pivot Points
Woodie’s formula adjusts the emphasis, placing more weight on the closing price of the previous period. This adjustment aims to capture the market’s sentiment more accurately, offering a slightly different perspective on potential support and resistance levels.
- Distinctive Approach:
- Unlike the standard method, Woodie’s Pivot Points calculate the central pivot with the current period’s open price, adding a unique twist to predicting market movements.
Choosing the Right Type for Your Strategy
Each type of Pivot Point brings a different flavor to market analysis, and the choice largely depends on a trader’s specific strategy, trading style, and the particular market being traded. Experimenting with different types and integrating them with other indicators can unlock deeper insights into market behavior and enhance trading performance.
How to Use Pivot Points in Trading Strategies
Crafting Effective Trades with Structured Approaches
Pivot Points are a versatile tool in the Forex trader’s toolkit, offering clear strategies for capitalizing on market movements. Here’s how to integrate them into your trading approach:
1. Identifying Market Sentiment
- Use the central pivot point (P) as a baseline to gauge market sentiment.
- A market trading above P suggests bullish sentiment, while trading below indicates bearish trends.
2. Setting Entry and Exit Points
- Consider buying near a support level (S1, S2, S3) in an uptrend or selling near a resistance level (R1, R2, R3) in a downtrend.
- Use resistance levels as potential exit points for long positions and support levels for short positions.
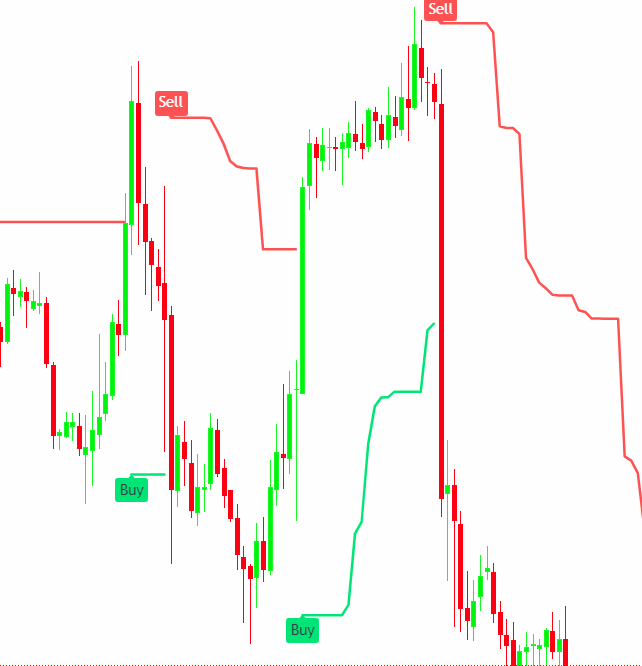
3. Spotting Potential Reversals
- Watch for price actions around pivot levels. A bounce off a support or resistance level may indicate a potential reversal.
- Confirm reversals with other indicators (like MACD, RSI) for higher accuracy.
4. Breakout Trading
- In case of a breakout above a resistance level or below a support level, consider entering a trade in the direction of the breakout.
- Set a stop-loss just outside the broken level to minimize risk.
5. Combining with Candlestick Patterns
- Enhance pivot point strategies by integrating candlestick patterns for entry and exit signals.
- For example, a bullish engulfing pattern near a support level may offer a strong buy signal.
6. Risk Management
- Always set stop-loss orders to manage risk effectively. Consider placing stop-loss orders just below a support level for long trades or above a resistance level for short trades.
- Adjust position sizes based on the distance to your stop-loss to maintain consistent risk management.
7. Adaptation to Market Conditions
- Be flexible and adjust your strategy based on prevailing market conditions. Pivot points are dynamic and recalculated daily, offering fresh insights each trading day.
8. Continuous Learning and Practice
- Practice these strategies in a demo account to build confidence and refine your approach before going live.
Tips for Integrating Pivot Points with Other Indicators
Creating a Robust Trading System
Pivot Points provide a solid foundation for market analysis, but their power multiplies when combined with other technical indicators. Here’s how to integrate Pivot Points with other tools for a comprehensive trading approach:
1. Combine with Trend Indicators
- Use moving averages (like the 50-day or 200-day SMA) to determine the overall market trend.
- Trade in the direction of the trend: consider buying near pivot support levels in an uptrend and selling near pivot resistance levels in a downtrend.
2. Enhance with Momentum Indicators
- Apply momentum indicators such as the Relative Strength Index (RSI) or Stochastics to confirm pivot point signals.
- For instance, a pivot point support bounce accompanied by an oversold RSI signal can reinforce a buy decision.
3. Validate with Volume Indicators
- Incorporate volume indicators like the Volume Oscillator or On-Balance Volume (OBV) to confirm breakout or reversal signals at pivot levels.
- Increased volume at a pivot level breakout suggests a strong move, adding confidence to the trade.
4. Refine with Oscillators
- Use oscillators like the MACD to identify potential reversals or continuation signals around pivot levels.
- A bullish crossover near a pivot support can indicate a strong entry point, while a bearish crossover near a pivot resistance may signal an exit or short opportunity.
5. Apply with Chart Patterns
- Integrate pivot points analysis with chart patterns (like triangles, flags, or head and shoulders) for pinpointing entry and exit points.
- Pivot levels can act as key levels within these patterns, providing strategic trade execution points.
6. Consider Price Action
- Pay attention to price action and candlestick patterns around pivot points. Patterns like hammer, engulfing, or doji near pivot levels can provide additional trade confirmation.
7. Adapt and Test Strategies
- Adapt your approach based on the indicator combinations that best suit your trading style and the asset you’re trading.
- Backtest your strategies using historical data to ensure their effectiveness before applying them in real trading scenarios.
8. Keep It Simple
- Avoid cluttering your charts with too many indicators, which can lead to analysis paralysis. Find a balance that offers clear signals without overwhelming you.
Common Mistakes to Avoid with Pivot Points
Navigating Pivot Point Trading with Caution
Pivot Points are a powerful tool in Forex trading, but like any strategy, they come with pitfalls. Awareness and avoidance of these common mistakes can enhance your trading effectiveness:
1. Overreliance on Pivot Points Alone
- Don’t use Pivot Points in isolation. Integrate them with other indicators and analysis methods to confirm signals and strengthen your trading decisions.
2. Ignoring Market Context
- Always consider the broader market context. Pivot Points may not be as effective during major news events or in very volatile markets where price movements can defy technical analysis.
3. Misinterpreting Support and Resistance
- Understand that support and resistance levels are zones, not exact prices. Expect some price fluctuation around these levels and plan your trades accordingly.
4. Forgetting to Adjust for Time Zones
- Pivot Points are sensitive to the trading session’s start and end times. Ensure you’re using the correct time zone for the market you’re trading to get accurate levels.
5. Neglecting Risk Management
- Even with clear Pivot Point signals, always implement sound risk management practices. Use stop-loss orders and manage your trade size to protect your capital.
6. Chasing Breakouts Blindly
- Be cautious with breakout trades around Pivot Points. Confirm breakouts with additional indicators or volume to avoid false signals.
7. Overcomplicating Your Strategy
- Adding too many levels or combining too many indicators can make your strategy complex and difficult to follow. Keep your approach simple and focused.
8. Failing to Backtest
- Before fully committing to a Pivot Point strategy, backtest it on historical data to understand its potential performance and tweak it as necessary.
9. Ignoring Pivot Point Adjustments
- Be aware that Pivot Points need recalibration for different markets or trading styles. There’s no one-size-fits-all; adjust your calculations based on your trading approach and market conditions.
10. Underestimating Learning Curve
- Take the time to thoroughly understand how Pivot Points work and how they fit into the broader context of technical analysis. Don’t rush into trading without a solid grasp of the basics.
Conclusion
Pivot Points stand as a cornerstone in the realm of Forex trading, offering a structured and insightful approach to market analysis. By demystifying price movements and highlighting key support and resistance levels, they empower traders to navigate the complexities of the market with greater confidence and precision.
The journey to Pivot Point mastery involves more than understanding their calculation and types; it’s about weaving them into a coherent, flexible trading strategy that also respects market context and leverages complementary indicators. The true art lies in interpreting these signals within the broader tapestry of market dynamics, economic indicators, and global events.
Awareness of common pitfalls and a commitment to continuous learning and adaptation are crucial. By sidestepping the traps of overreliance and oversimplification, traders can harness Pivot Points’ full potential, making informed decisions that balance risk and reward.

