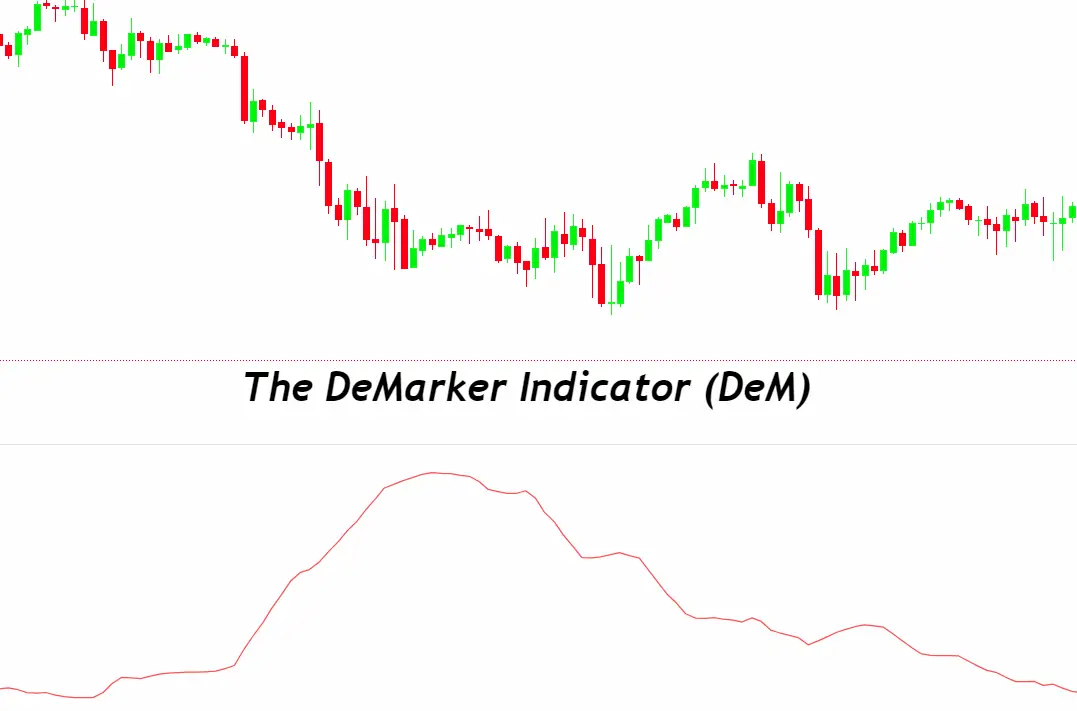
The DeMarker Indicator (DeM) is a technical analysis tool used by traders to assess the directional bias of a market. It helps in identifying potential buying or selling opportunities by evaluating the demand for an underlying asset. DeM operates by comparing the most recent high and low prices to the corresponding high and low prices of the previous period. This comparison aims to gauge the price exhaustion levels, which can indicate a possible reversal or continuation of the current trend.
DeM values typically oscillate between 0 and 1. Readings above a certain threshold, often 0.7, suggest that the market is entering overbought territory, signaling a potential selling opportunity. Conversely, readings below a specific level, commonly 0.3, indicate an oversold condition, hinting at a potential buying opportunity. Traders use these insights to make more informed decisions on when to enter or exit trades, aiming to capitalize on the anticipated price movements.
How the DeMarker Indicator Works
The DeMarker Indicator (DeM) works by comparing the current period’s high and low prices with those of the previous period to assess the demand pressure in the market. Here’s a simplified breakdown of how it operates:
- Calculation of DeMax and DeMin:
- DeMax (DeMarker Maximum): If the current high is greater than the previous high, DeMax is the difference between the two. If not, DeMax is set to zero.
- DeMin (DeMarker Minimum): If the current low is less than the previous low, DeMin is the difference between the two. If not, DeMin is set to zero.
- Smoothed Averages:
- Calculate the smoothed moving average of DeMax and DeMin over a certain period, typically 14 days.
- DeMarker Formula:
- The DeMarker value is calculated by dividing the smoothed average of DeMax by the sum of the smoothed averages of DeMax and DeMin.
The resulting DeM value, which ranges between 0 and 1, helps traders identify potential price exhaustion points. Values nearing 1 indicate overbought conditions, suggesting a possible downturn, while values close to 0 indicate oversold conditions, hinting at a potential upturn. Traders use these insights, along with other analysis tools, to make informed decisions on entering or exiting trades.
Benefits of Using the DeMarker Indicator
Using the DeMarker Indicator (DeM) in Forex trading offers several benefits:
- Identifies Overbought and Oversold Zones: DeM helps pinpoint market conditions where prices are potentially overextended, signaling possible reversals.
- Enhances Decision Making: By providing clear signals, DeM assists traders in making more informed entry and exit decisions.
- Versatile in Different Market Conditions: DeM can be effective in both trending and range-bound markets, offering flexibility in various trading strategies.
- Simple to Interpret: With values oscillating between 0 and 1, DeM’s straightforward interpretation makes it accessible for traders at all levels.
- Risk Management: By identifying potential reversal points, DeM can aid in setting more precise stop-loss and take-profit levels, improving overall risk management.
- Complements Other Indicators: When used alongside other technical analysis tools, DeM can help confirm trends and signals, leading to more robust trading strategies.
Step-by-Step Guide to Using DeM in Forex Trading
To effectively use the DeMarker Indicator (DeM) in Forex trading, follow this step-by-step guide:
1. Setting Up DeM in Your Trading Platform
- Locate the DeMarker Indicator in your platform’s list of indicators.
- Apply it to your chart, typically with a default period setting of 14. Adjust the period based on your trading strategy and analysis needs.
2. Reading DeM Values and Their Meanings
- Overbought Zone: DeM values above 0.7 indicate an overbought market condition, suggesting potential selling opportunities as the price might reverse downwards.
- Oversold Zone: DeM values below 0.3 signal an oversold market condition, indicating potential buying opportunities as the price might reverse upwards.
3. Integrating DeM with Trading Strategies
- Trend Confirmation: Use DeM in conjunction with trend indicators to confirm the strength and direction of the market trend.
- Divergence: Look for divergences between DeM values and price action. A divergence occurs when the price makes a new high or low that is not confirmed by the DeM, potentially signaling a reversal.
- Threshold Crossovers: Pay attention to when DeM values cross above or below key thresholds (0.7 for overbought and 0.3 for oversold). These crossovers can signal entry or exit points.
4. Practice and Experimentation
- Test the DeM indicator in a demo account to understand its behavior and signals in various market conditions without financial risk.
- Adjust the DeM settings and combine it with other indicators to find the best strategy that suits your trading style.
By following these steps, traders can effectively incorporate the DeMarker Indicator into their Forex trading strategy, aiding in decision-making and potentially increasing the success of their trades.
Tips for Maximizing Success with DeMarker Indicator
To maximize success when using the DeMarker Indicator (DeM) in Forex trading, consider these tips:
- Combine with Other Indicators: Use DeM alongside trend indicators (like moving averages) and oscillators (like RSI or MACD) to confirm signals and reduce false positives.
- Watch for Divergence: Look for discrepancies between DeM readings and price action. A divergence may indicate a potential reversal.
- Use in Multiple Timeframes: Analyze DeM signals across different timeframes to get a broader view of the market and confirm trading signals.
- Set Clear Thresholds: While 0.7 and 0.3 are common thresholds for overbought and oversold conditions, adjust these levels based on historical performance and market volatility.
- Incorporate Price Action: Combine DeM signals with price action patterns (like support/resistance levels, candlestick patterns) to enhance the decision-making process.
- Risk Management: Always use DeM as part of a broader risk management strategy, including stop-loss orders and position sizing, to protect your capital.
- Continuous Learning: Stay informed about market conditions and be ready to adapt your strategy as needed. Regularly review your trades to learn from successes and mistakes.
- Patience is Key: Wait for clear DeM signals before making a trade, and avoid overtrading based on ambiguous or weak indications.
By following these tips, traders can leverage the DeMarker Indicator more effectively, improving their chances of successful trades in the Forex market.
Common Mistakes to Avoid with DeMarker Indicator
When using the DeMarker Indicator (DeM) in Forex trading, avoid these common mistakes to enhance your trading strategy:
- Overreliance on DeM Alone: Relying solely on DeM without considering other indicators, market trends, or economic news can lead to misleading signals.
- Ignoring Market Context: Not taking into account the broader market context or trading environment can result in misinterpreting DeM signals.
- Disregarding Divergence: Failing to recognize divergences between DeM values and price action can cause missed opportunities for detecting potential reversals.
- Impatience with Signal Confirmation: Acting on DeM signals without waiting for additional confirmation can increase the risk of entering trades prematurely.
- Misinterpreting Overbought/Oversold Levels: Assuming that every time DeM enters overbought or oversold territory a reversal is imminent, without considering the strength of the prevailing trend, can lead to false trades.
- Neglecting Risk Management: Not using stop-loss orders or improper position sizing when trading on DeM signals can lead to significant losses.
- Inflexibility in Threshold Settings: Using default threshold settings without adjusting them to suit specific currency pairs or market conditions can diminish the effectiveness of DeM signals.
By being aware of and avoiding these mistakes, traders can utilize the DeMarker Indicator more effectively in their Forex trading strategy, leading to better-informed trading decisions and improved risk management.
Real-Life Examples of DeMarker Indicator in Action
Real-life examples of the DeMarker Indicator (DeM) in action can illustrate its practical application in Forex trading. Here are two scenarios where DeM provided valuable insights:
Example 1: Identifying Overbought Conditions and Potential Reversals
- Scenario: The EUR/USD pair has been on an uptrend for several days.
- DeM Observation: The DeM value rises above the 0.7 threshold, indicating an overbought condition.
- Action Taken: Traders consider this a signal to prepare for a potential short position, anticipating a price reversal.
- Outcome: Soon after the DeM reaches overbought levels, the EUR/USD pair shows signs of exhaustion and begins to reverse, validating the DeM signal.
Example 2: Spotting Oversold Conditions and Bounce-back Opportunities
- Scenario: The USD/JPY pair experiences a sharp decline over a short period.
- DeM Observation: The DeM value drops below the 0.3 threshold, signaling an oversold condition.
- Action Taken: Traders view this as an opportunity to enter long positions, expecting the price to bounce back.
- Outcome: Following the DeM signal, the USD/JPY pair finds support and starts to recover, offering a profitable opportunity for those who acted on the DeM indicator’s signal.
These examples demonstrate how the DeMarker Indicator can be a powerful tool in a trader’s arsenal, helping to identify potential turning points in the market by highlighting overbought and oversold conditions. By integrating DeM with other technical analysis tools and adhering to sound risk management practices, traders can enhance their decision-making process and improve their trading outcomes.
Conclusion
In conclusion, the DeMarker Indicator (DeM) stands as a valuable tool in the realm of Forex trading, offering traders insights into overbought and oversold market conditions, and aiding in the identification of potential price reversals. Its simplicity and effectiveness make it suitable for traders of all levels, from novices to seasoned professionals. By integrating DeM with other technical analysis tools and adhering to disciplined risk management practices, traders can make more informed decisions, potentially enhancing their trading performance.
However, it’s crucial to remember that no indicator is foolproof. Success in Forex trading involves a combination of factors, including a well-thought-out trading strategy, continuous learning, and the ability to adapt to changing market conditions. Avoiding common pitfalls, such as overreliance on a single indicator or ignoring broader market context, can further improve the effectiveness of using DeM in trading.
Ultimately, the DeMarker Indicator, when used wisely, can be a powerful addition to a trader’s toolkit, providing valuable signals that, when confirmed and acted upon judiciously, can lead to rewarding trading opportunities.

