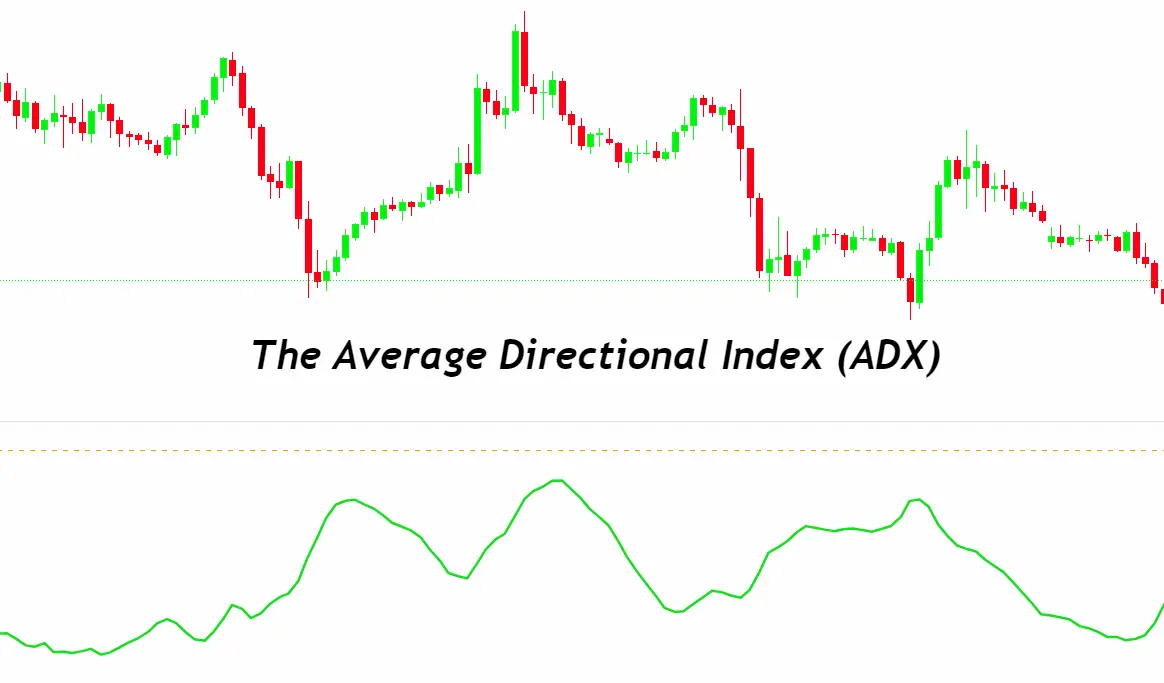
The Average Directional Index (ADX) is a technical analysis indicator used to quantify the strength of a trend in the forex market. It does not indicate the trend direction but rather its momentum, helping traders decide whether to enter or exit a trade. The ADX is part of the Directional Movement System developed by J. Welles Wilder Jr. and includes two other indicators: the Positive Directional Indicator (+DI) and the Negative Directional Indicator (-DI). These help in determining the trend direction. An ADX value over 25 typically suggests a strong trend, while below 20 indicates a weak trend or market sideways movement.
Components of ADX
The Average Directional Index (ADX) comprises three key components:
- Positive Directional Indicator (+DI): Reflects upward trend strength. It compares the current high to the previous high and is a part of calculating the ADX.
- Negative Directional Indicator (-DI): Represents downward trend strength. It compares the current low to the previous low, also contributing to the ADX calculation.
- ADX Line: Measures the strength of the trend, regardless of its direction. It’s derived from the smoothed averages of the differences between +DI and -DI over a specified period, usually 14 days.
These components work together to help traders assess the strength and direction of market trends, aiding in making more informed trading decisions.
How ADX Works
The Average Directional Index (ADX) operates by combining the Positive Directional Indicator (+DI) and Negative Directional Indicator (-DI) to measure the strength of a trend. Here’s a simplified explanation of how it works:
- Calculate the Directional Movement (DM): Determine the differences between the current high and previous high (for +DM) and the current low and previous low (for -DM).
- Calculate the True Range (TR): The largest of the following:
- Current high minus current low
- Absolute value of the current high minus the previous close
- Absolute value of the current low minus the previous close
- Smooth the DM and TR: Apply a smoothing technique, typically over 14 periods, to both the +DM, -DM, and the TR to obtain smoothed averages.
- Calculate the Directional Indicators: Divide the smoothed +DM by the smoothed TR to get +DI, and the smoothed -DM by the smoothed TR to get -DI.
- Calculate the ADX: Find the absolute difference between +DI and -DI, divide it by the sum of +DI and -DI (to get the DX), and then apply a moving average to the DX values to get the ADX.
The ADX value is plotted as a line, usually with a scale from 0 to 100, where values above 25 indicate a strong trend, and values below 20 suggest a weak trend or market consolidation. The +DI and -DI lines help determine the trend’s direction, with the higher line indicating the prevailing trend direction.
Benefits of Using ADX
Using the Average Directional Index (ADX) in forex trading offers several benefits:
- Trend Strength Identification: ADX quantifies the strength of a trend, helping traders to distinguish between strong trends worth following and weak trends that might not justify trading.
- Risk Management: By indicating trend strength, ADX aids traders in setting stop-loss orders more effectively, potentially reducing losses during weak trends.
- Filter Trades: Traders use ADX to filter out trades in a ranging market, focusing on trades that align with strong trends, thereby improving the quality of trade entries.
- Strategy Confirmation: ADX works well in combination with other indicators, providing a confirmation signal for various trading strategies, and enhancing decision-making.
- Versatility: ADX applies to any time frame, making it suitable for day traders, swing traders, and long-term investors alike.
- Market Direction Insight: Though ADX itself does not indicate direction, the relative values of +DI and -DI offer insights into the market’s direction, complementing the trend strength information provided by ADX.
By utilizing ADX, traders can make more informed decisions, align their trades with strong trends, and potentially increase their chances of successful trades.
How to Interpret ADX in Trading Strategies
Interpreting the Average Directional Index (ADX) in trading strategies involves analyzing ADX values along with the Positive (+DI) and Negative (-DI) Directional Indicators. Here’s how to use ADX in your trading strategies:
Low ADX Values (Below 20)
- Indicate Weak Trend or Range-Bound Market: When ADX is below 20, it suggests that the market is not trending strongly, possibly moving sideways. It’s a signal for traders to be cautious with trend-following strategies.
- Consider Non-Trending Strategies: In such markets, consider using range-bound strategies, like trading support and resistance levels or oscillators that work well in sideways markets.
Moderate ADX Values (20 to 25)
- Emerging Trends: As ADX moves above 20, it may indicate the start of a new trend. Traders should watch the +DI and -DI crossover for potential entry signals in the direction of the emerging trend.
High ADX Values (Above 25)
- Strong Trends: An ADX value above 25 signifies a strong trend, providing a green light for trend-following strategies.
- +DI and -DI Crossovers: Pay attention to the +DI and -DI lines. When +DI crosses above -DI, it suggests a potential upward trend. Conversely, when -DI crosses above +DI, it suggests a potential downward trend.
- Trend Continuation or Reversals: In strong trends, use other indicators for confirmation on whether the trend is likely to continue or reverse. This can help in deciding whether to hold, enter, or exit positions.
Very High ADX Values (Above 50)
- Extremely Strong Trends: Though less common, ADX values above 50 indicate very strong trends. However, be cautious, as such strong trends can sometimes precede a reversal due to potential overextension.
General Strategy Tips
- Combine with Other Indicators: Use ADX in conjunction with other technical analysis tools to confirm trend strength, direction, and potential entry and exit points.
- ADX Slope: The slope of the ADX line is also important. An increasing ADX slope indicates strengthening trend, while a decreasing slope suggests a weakening trend.
By interpreting ADX values correctly and using them in conjunction with other indicators, traders can enhance their trading strategies, making more informed decisions about entries, exits, and trade management.
Practical Tips for Using ADX
To effectively incorporate the Average Directional Index (ADX) into your trading strategy, consider these practical tips:
- Use ADX for Trend Confirmation: Utilize ADX to confirm the presence of a trend. A rising ADX indicates increasing trend strength, making it a good time to consider entering trend-following trades.
- Wait for ADX to Rise Above 20: Before making a trade based on a trend, wait for the ADX value to rise above 20, which suggests that a notable trend is forming.
- Watch the +DI and -DI Crossovers: Pay attention to crossovers between +DI and -DI lines. A +DI crossing above -DI can signal a bullish trend, while -DI crossing above +DI may indicate a bearish trend.
- Combine with Other Indicators: Enhance your trading strategy by using ADX in conjunction with other technical indicators. For example, use moving averages to identify the trend direction and ADX to gauge its strength.
- Consider the ADX Slope: Not just the ADX value but also its slope is crucial. An upward slope in ADX suggests strengthening trend momentum, which can support decision-making in trade entries or exits.
- Be Cautious with High ADX Values: Extremely high ADX values (above 50) might indicate an overextended market, which could be prone to reversals. Exercise caution and consider taking profits or tightening stop-losses.
- Adjust Time Frames: ADX is versatile and can be applied across different time frames. Use shorter time frames for day trading and longer ones for swing or position trading to align the indicator with your trading style.
- Practice Patience: Allow the ADX indicator time to develop and show clear signals before making your trade decisions. Avoid reacting to minor fluctuations to reduce the risk of false signals.
- Backtest Strategies: Before applying ADX-based strategies in live trading, backtest them on historical data to understand how they perform under various market conditions.
- Continuous Learning: Keep educating yourself on the nuances of ADX and other complementary indicators. The more you understand about how indicators interact with market conditions, the better you can tailor your strategies.
Incorporating these tips can help you make more informed decisions using the ADX, improving your trading effectiveness by capitalizing on strong trends while managing risks.
Common Mistakes to Avoid with ADX
When using the Average Directional Index (ADX) in forex trading, it’s essential to be aware of common mistakes to avoid:
- Ignoring ADX Level: Trading on +DI and -DI crossovers without considering the ADX level can lead to false signals. Always ensure ADX is above 20 to confirm trend strength.
- Overreliance on ADX: Relying solely on ADX for trading decisions without using other indicators or price action analysis can result in missed context and poor trades.
- Misinterpreting ADX Values: High ADX values indicate strong trends, but they don’t specify if it’s a buying or selling opportunity. Use +DI and -DI for direction cues.
- Neglecting Volatility: High ADX values in volatile markets might not always indicate a sustainable trend. Consider market context and volatility before trading.
- Ignoring Trend Direction: ADX measures trend strength, not direction. Failing to use +DI and -DI for trend direction can lead to trades against the prevailing trend.
- Impatience with Entry Signals: Acting on the initial crossover of +DI and -DI without waiting for ADX to confirm trend strength can result in premature entries.
- Not Factoring in ADX Slope: The slope of the ADX line is significant. A flat ADX can indicate a weak trend, even if the value is above 20.
- Chasing Extremely High ADX Values: Extremely high ADX values (e.g., above 50) might indicate an overextended trend that could reverse. Exercise caution in these scenarios.
- Failing to Adjust Time Frames: Not adjusting the ADX settings to match your trading time frame can lead to misleading signals. Ensure the settings align with your trading strategy.
- Lack of Backtesting: Failing to backtest ADX-based strategies on historical data can lead to unexpected outcomes when applied in live trading.
Avoiding these mistakes can enhance your trading strategy, making your use of ADX more effective and helping you make more informed trading decisions.
Real-World Application of ADX
In real-world forex trading, the Average Directional Index (ADX) serves as a powerful tool to gauge trend strength and inform trading decisions. Here are some practical applications:
Identifying Trending Markets
Traders use ADX to distinguish between trending and non-trending conditions. An ADX value above 25 often indicates a strong trend, guiding traders to apply trend-following strategies.
Confirming Trade Entries
When the +DI crosses above the -DI and the ADX is rising above 20, it signals a potential entry point for a long position. Conversely, when the -DI crosses above the +DI under the same ADX conditions, it may suggest a short opportunity.
Exit or Hold Decisions
A declining ADX, especially after a high reading, can signal the weakening of a trend. Traders might consider this as a cue to take profits or tighten stop-loss orders to protect gains.
Diversifying Strategies
Traders often combine ADX with other indicators like moving averages or Fibonacci retracement levels to confirm trend strength and potential reversal points, enhancing the robustness of their strategies.
Time Frame Analysis
ADX is adaptable to various time frames, allowing day traders to use shorter periods, like 15-minute or 1-hour charts, and swing traders to use daily charts. This flexibility enables traders to align the indicator with their trading style.
Case Study: Trend Reversal Signal
A trader notices that after a prolonged uptrend signaled by a high ADX and +DI above -DI, the -DI crosses above the +DI while the ADX starts to decline from a high value. The trader interprets this as a potential trend reversal and decides to exit the long position, securing profits before the trend changes direction.
Risk Management
By assessing trend strength, traders can better manage risk, placing stop-loss orders at more strategic points. For instance, in a strong uptrend indicated by a high ADX, a trader might set a stop loss just below a recent swing low, expecting the trend to continue.
Incorporating ADX into real-world trading strategies offers traders a more nuanced understanding of market dynamics, enabling them to make more informed decisions and potentially enhance their trading performance.
Conclusion
In conclusion, the Average Directional Index (ADX) stands as a pivotal tool in the arsenal of forex traders, adept at quantifying trend strength and thereby offering valuable insights for making informed trading decisions. Its ability to differentiate between strong and weak market trends empowers traders to capitalize on robust trends while steering clear of less promising, range-bound market conditions.
The practical application of ADX extends beyond mere trend identification; it serves as a cornerstone for confirming trade entries and exits, enhancing risk management, and fine-tuning trading strategies when used in conjunction with other technical indicators. By avoiding common pitfalls such as overreliance on ADX or misinterpreting its signals, traders can harness its full potential to bolster their trading outcomes.
Whether you’re a novice trader seeking to navigate the complexities of the forex market or an experienced trader looking to refine your strategy, incorporating ADX into your technical analysis toolkit can provide a significant edge. Remember, successful trading is not just about the tools you use but also about how effectively you can interpret and act on the information they provide. Practice, continuous learning, and a well-rounded approach to market analysis are key to leveraging ADX and other indicators to achieve trading success.

