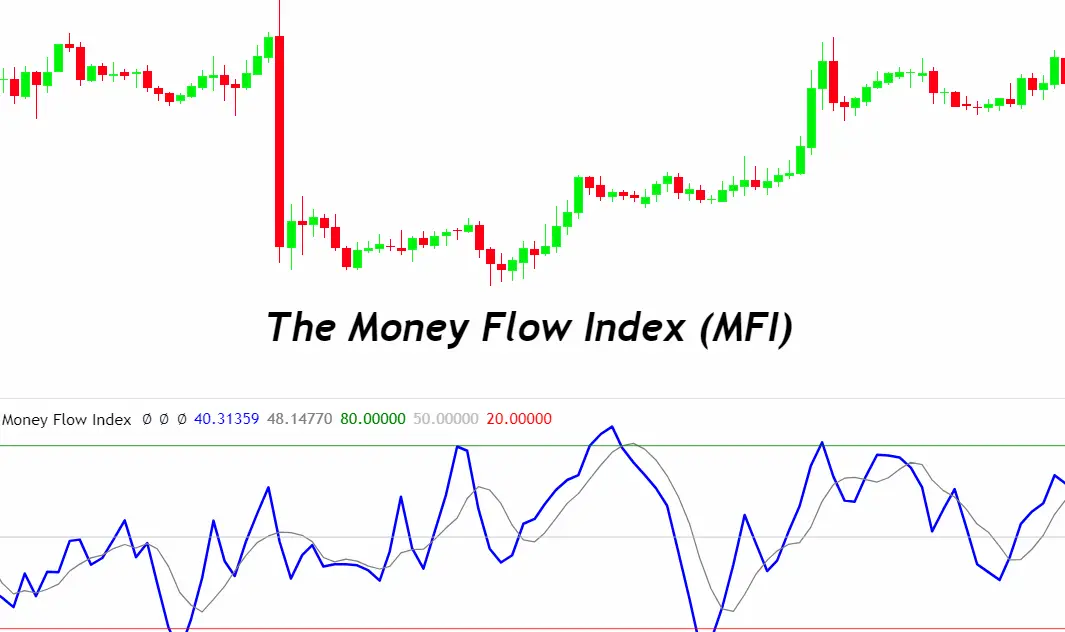
The Money Flow Index (MFI) is a momentum indicator that measures the flow of money into and out of a security over a specific period. It is similar to the Relative Strength Index (RSI) but, instead of just considering price changes, MFI also takes into account the volume of trades. This combination allows traders to evaluate the strength of buying or selling pressure behind market moves.
The MFI oscillates between 0 and 100, and is typically calculated over a 14-day period, although this can be adjusted for different trading strategies. A value above 80 suggests a security may be overbought, indicating a potential sell-off, while a value below 20 suggests a security may be oversold, indicating a potential upward correction.
MFI is particularly useful in identifying divergences between the indicator and market price, which can signal potential reversals. For instance, if a security’s price is making new highs but MFI is failing to reach new highs, it may indicate weakening buying pressure and a possible trend reversal.
Traders use MFI to complement other analysis tools and indicators, making more informed decisions by assessing not just the direction of price movements, but also the underlying momentum and the volume of trades contributing to these movements.
How MFI Works
The Money Flow Index (MFI) works by quantifying the amount of money flowing into and out of a security, combining price movement and volume to indicate the strength of buying or selling pressure. The process involves several steps to calculate the MFI value, which oscillates between 0 and 100. Here’s a simplified overview of how MFI works:
- Typical Price Calculation: For each period (usually a day), calculate the ‘Typical Price’ by taking the average of the high, low, and close prices [(High + Low + Close) / 3].
- Raw Money Flow: Multiply the Typical Price by the volume for that period to get the ‘Raw Money Flow’. This step combines price and volume to assess the total value of trade flow.
- Money Flow Ratio: Over a specified number of periods (commonly 14 days), classify each day as a positive or negative money flow, depending on whether the Typical Price is higher or lower than the previous period. Then, sum up the positive money flows and divide by the sum of negative money flows to get the ‘Money Flow Ratio’.
- Money Flow Index Calculation: Finally, use the Money Flow Ratio to calculate the MFI using the formula:
[ MFI = 100 – \left( \frac{100}{1 + \text{Money Flow Ratio}} \right) ]
The resulting MFI value helps traders understand the market’s sentiment towards a security. Values above 80 typically indicate that the security is overbought and might be primed for a price decline, whereas values below 20 suggest the security is oversold and could be headed for a price increase. Traders also watch for divergences between MFI and price action, as these can signal potential reversals or shifts in market momentum.
Importance of MFI in Forex Trading
The Money Flow Index (MFI) plays a crucial role in Forex trading by providing insights that help traders make informed decisions. Its importance in the Forex market can be attributed to several key factors:
- Market Sentiment Analysis: MFI helps gauge the overall sentiment in the Forex market by combining price and volume information. This insight allows traders to understand whether a currency pair is experiencing buying or selling pressure, which is pivotal for predicting future price movements.
- Identification of Overbought/Oversold Conditions: By indicating when a currency pair is overbought (MFI above 80) or oversold (MFI below 20), the MFI enables traders to anticipate potential reversals. This information is valuable for planning entry and exit points in the market.
- Divergence Signals: MFI is particularly useful in identifying divergences between the indicator and price action. For example, if the price of a currency pair is making new highs but the MFI is not, this could signal weakening momentum and a possible price reversal, providing a strategic advantage to traders.
- Volume-Weighted Confirmation: Unlike many other momentum indicators that only consider price, MFI also incorporates volume, offering a more comprehensive view of market dynamics. This helps confirm the strength of price movements, as high volume typically accompanies significant price changes, reinforcing the validity of a trend.
- Risk Management: By providing insights into potential price reversals and market sentiment, MFI aids traders in managing risk. Understanding the strength behind price movements can help in setting more effective stop-loss orders and managing positions to avoid significant losses.
- Complementing Other Indicators: MFI can be used in conjunction with other technical indicators and analysis tools to develop a well-rounded trading strategy. For example, combining MFI with trend indicators or support and resistance levels can enhance decision-making and improve the accuracy of trade predictions.
The Money Flow Index is a valuable tool in Forex trading, offering a unique blend of price and volume analysis to assess buying or selling pressure, identify potential market reversals, and enhance overall trading strategies through a deeper understanding of market sentiment and momentum.
Reading MFI Signals
Reading Money Flow Index (MFI) signals effectively can enhance trading strategies by providing insights into market conditions and potential price movements. Here are key aspects to consider when interpreting MFI signals:
Overbought and Oversold Levels
- Overbought Condition (MFI > 80): Indicates strong buying pressure and potential for a price correction or reversal. Traders might consider taking profits on long positions or preparing for a short entry.
- Oversold Condition (MFI < 20): Suggests strong selling pressure and a possibility for a price bounce or reversal. This can be a signal for traders to look for buying opportunities or to cover short positions.
Divergence
- Bullish Divergence: Occurs when the price is making lower lows, but MFI is making higher lows. This indicates weakening selling pressure and a potential upward price reversal.
- Bearish Divergence: Happens when the price is making higher highs, but MFI is making lower highs. This signals weakening buying pressure and a potential downward price reversal.
MFI and Price Trends
- MFI Trending with Price: When both price and MFI are moving in the same direction, it confirms the current trend’s strength, suggesting that the trend is likely to continue.
- MFI Trending Opposite to Price: If MFI is moving in the opposite direction of the price, it can indicate a weakening trend and potential for a trend reversal.
MFI Threshold Crossings
- Crossing Above 20: When MFI moves up and crosses above the 20 level, it can signal a shift from an oversold condition to a starting bullish momentum.
- Crossing Below 80: An MFI move down, crossing below the 80 level, can indicate a shift from an overbought condition to starting bearish momentum.
Using MFI in Context
- Consider Market Context: Always interpret MFI signals within the broader market context, including trends, news, and other technical indicators.
- Volume Confirmation: Since MFI incorporates volume, consider the volume trends alongside MFI signals for additional confirmation.
By carefully analyzing MFI signals in the context of market conditions and other technical indicators, traders can make more informed decisions, identify potential entry and exit points, and manage risk more effectively.
MFI vs. Other Indicators
Comparing the Money Flow Index (MFI) with other trading indicators helps highlight its unique features and how it complements other tools in a trader’s arsenal. Here’s a comparison of MFI with two commonly used indicators: the Relative Strength Index (RSI) and the Moving Average Convergence Divergence (MACD).
MFI vs. RSI
- Similarity: Both MFI and RSI are momentum oscillators that range from 0 to 100, used to identify overbought and oversold conditions.
- Key Difference: The main difference lies in their calculations; RSI only considers price changes, while MFI incorporates both price and volume. This inclusion of volume makes MFI potentially more reflective of the true market sentiment, as it accounts for the strength behind price movements.
- Application: RSI might be preferred for markets where volume data is less reliable or unavailable, while MFI is particularly useful when volume is considered a significant factor in confirming price movements.
MFI vs. MACD
- Differences in Function: MACD is a trend-following momentum indicator that shows the relationship between two moving averages of a security’s price, whereas MFI is a volume-weighted oscillator that measures buying and selling pressure.
- Signal Generation: MACD generates signals from crossovers, overbought/oversold conditions, and divergences, focusing more on the trend’s direction and strength. MFI, on the other hand, emphasizes the volume of money flowing in and out of a security, providing insights into potential reversals due to overbought or oversold conditions.
- Complementary Use: Traders often use MACD in conjunction with MFI to get a comprehensive view of the market. MACD can identify the trend’s direction and momentum, while MFI can confirm these signals with volume-based insights, offering a more rounded analysis.
Integration with Other Indicators
- Holistic Approach: While MFI provides valuable insights, especially regarding volume, it’s most effective when used in conjunction with other indicators. No single indicator can provide all the answers; each has its strengths and weaknesses.
- Confirmation and Divergence: Using MFI to confirm signals from trend-following indicators (like moving averages) or to identify divergences with other momentum indicators (like RSI or MACD) can enhance the reliability of trading signals.
In summary, MFI’s unique incorporation of volume with price changes offers a distinct perspective on market dynamics, making it a valuable tool in a trader’s toolkit. However, its effectiveness increases when used alongside other indicators to validate its signals and build a comprehensive market analysis strategy.
Tips for Using MFI Effectively
Using the Money Flow Index (MFI) effectively in trading involves understanding its nuances and applying best practices. Here are some tips to help you utilize MFI to its full potential:
1. Combine MFI with Other Indicators
- Diversify Analysis: Avoid relying solely on MFI. Combine it with other indicators like Moving Averages, RSI, or MACD to confirm signals and strengthen your analysis.
2. Watch for Divergences
- Identify Reversals: Pay close attention to divergences between MFI and price action, as they can be early indicators of potential market reversals.
3. Use Appropriate Time Frames
- Match Your Strategy: Adjust the MFI time frame to suit your trading style. Short-term traders might use a shorter period for MFI, while long-term traders might prefer a longer period.
4. Understand MFI Thresholds
- Interpret Levels Correctly: Remember that MFI levels above 80 indicate overbought conditions and levels below 20 indicate oversold conditions. Use these thresholds to assess potential entry and exit points.
5. Confirm MFI Signals with Volume
- Volume Confirmation: Since MFI is volume-weighted, confirm MFI signals with actual volume trends. Increasing volume on MFI trend confirmations adds reliability to the signal.
6. Consider Market Context
- Factor in Market Conditions: Always interpret MFI signals within the broader market context, including current trends, news, and economic events.
7. Practice Risk Management
- Use Stop-Loss Orders: Protect your investments by setting stop-loss orders based on MFI signals and market analysis.
8. Backtest Your Strategy
- Test Before Applying: Backtest your MFI-based trading strategy on historical data to understand its effectiveness and make necessary adjustments.
9. Stay Patient and Disciplined
- Avoid Impulsive Decisions: MFI, like all indicators, isn’t foolproof. Stay patient, wait for clear signals, and adhere to your trading plan.
10. Keep Learning and Adapting
- Stay Informed: The markets are constantly changing. Keep learning and adapting your strategies to stay ahead.
By following these tips and continuously refining your approach, you can enhance your trading strategy and make more informed decisions using the Money Flow Index.
Common Mistakes to Avoid
When using the Money Flow Index (MFI) in trading, it’s crucial to be aware of common pitfalls that can undermine its effectiveness. Avoiding these mistakes can help you utilize MFI more efficiently in your trading strategy:
1. Overreliance on MFI Alone
- Diversify Tools: Relying solely on MFI for trading decisions can be risky. It’s essential to corroborate MFI signals with other indicators and analysis methods to get a more comprehensive market view.
2. Ignoring Divergences
- Pay Attention to Signals: Failing to recognize divergences between MFI and price action can lead to missed opportunities for detecting potential reversals. Always be on the lookout for such discrepancies.
3. Misinterpreting Overbought and Oversold Levels
- Understand Context: Just because MFI is above 80 or below 20 doesn’t necessarily mean an immediate reversal. Securities can remain overbought or oversold for extended periods. Context and confirmation are key.
4. Neglecting Volume Confirmation
- Check Volume Trends: Since MFI incorporates volume, it’s vital to confirm MFI signals with actual volume trends. Disregarding volume data can result in false signals.
5. Disregarding Market Conditions
- Factor in the Big Picture: MFI signals should not be interpreted in isolation. Market conditions, news, and economic indicators can greatly influence trading outcomes.
6. Inappropriate Time Frame Usage
- Match Time Frame to Strategy: Using an MFI setting that doesn’t align with your trading style can lead to misleading signals. Ensure the time frame of MFI matches your trading horizon.
7. Lack of a Clear Strategy
- Plan Your Trades: Entering trades without a clear strategy based on MFI signals can lead to poor decision-making. Define your entry, exit, and risk management criteria upfront.
8. Failure to Use Stop-Loss Orders
- Manage Risk: Not using stop-loss orders with MFI-based trades can result in significant losses. Always protect your positions against adverse market movements.
9. Chasing Signals
- Avoid Impulsiveness: Jumping into trades immediately after an MFI signal without waiting for confirmation can be risky. Patience is crucial in validating signals.
10. Sticking to a Single Period Setting
- Experiment with Settings: Using only the default MFI period (usually 14 days) without testing other settings can limit its effectiveness. Experiment with different periods to find what works best for your strategy.
By being mindful of these common mistakes and adopting a disciplined, well-rounded approach, traders can improve their use of the Money Flow Index and enhance their trading performance.
Conclusion
In conclusion, the Money Flow Index (MFI) is a powerful tool in the arsenal of Forex and stock traders, providing critical insights into market dynamics by combining price and volume data. Its ability to identify overbought and oversold conditions, along with potential price reversals through divergence detection, makes MFI a valuable component of technical analysis. However, like all trading tools, MFI should not be used in isolation. Effective trading strategies arise from the integration of MFI signals with other indicators, thorough market analysis, and an understanding of the broader economic context.
To harness the full potential of MFI, traders should avoid common pitfalls such as overreliance on the indicator, ignoring market conditions, and failing to confirm signals with volume trends. By applying MFI thoughtfully, in conjunction with other technical indicators and sound risk management practices, traders can enhance their decision-making process, spot valuable trading opportunities, and navigate the complexities of the market with greater confidence.
Remember, successful trading is not just about using the right tools but also about discipline, continuous learning, and adapting to the ever-changing market environment. The Money Flow Index, when used wisely, can contribute significantly to this endeavor, helping traders to make more informed and effective trading decisions.

