Introduction
Welcome to the dynamic world of Forex trading, where precision and strategy unlock the doors to success. Among the plethora of tools at a trader’s disposal, the Parabolic SAR stands out as a beacon for making informed decisions. This powerful indicator not only highlights potential reversals in market price but also provides clear signals for entry and exit points, making it an invaluable asset for traders aiming to navigate the Forex markets with confidence. Dive into the essence of the Parabolic SAR with us, and empower your trading journey with this indispensable tool.
Understanding Parabolic SAR
What is Parabolic SAR?
- Parabolic SAR stands for “Stop and Reverse.”
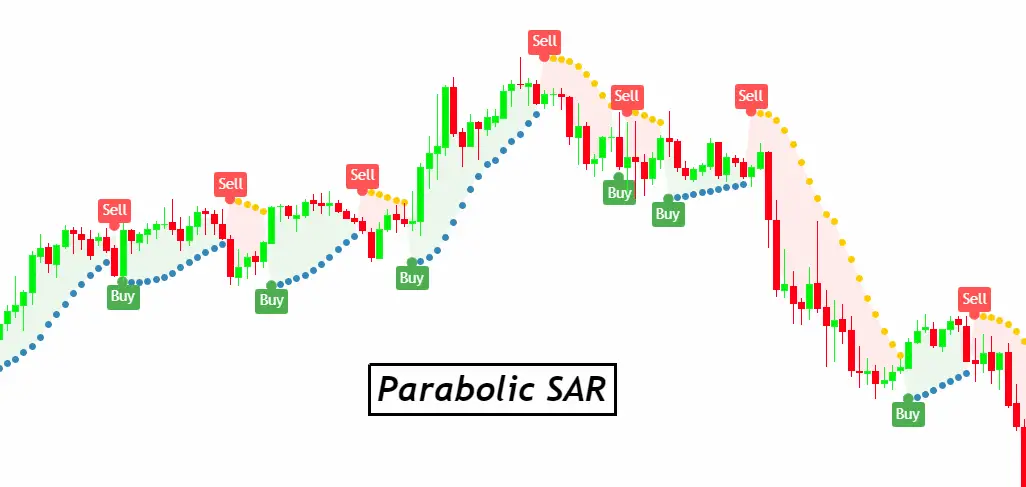
- It appears as dots on trading charts.
Origin and Creator
- Developed by J. Welles Wilder Jr.
- Introduced in his 1978 book.
Core Concept
- Tracks price direction over time.
- Dots below price indicate uptrend; above signal downtrend.
Key Features
- Provides clear visual cues.
- Helps identify potential reversals.
Understanding the Parabolic SAR is crucial for any trader looking to leverage its full potential in the Forex market. Its simplicity and effectiveness make it a favorite among traders worldwide.
How Parabolic SAR Works
Calculation Basics
- Relies on recent extreme prices (EP) and an acceleration factor (AF).
- Formula adjusts with each new period.
Chart Representation
- Appears as a series of dots relative to price action.
- Position of dots helps determine market trend.
Signal Interpretation
- Dots switch sides to signal potential trend reversals.
- Consistent position suggests a strong trend.
Adjusting Parameters
- Traders can tweak the AF for more sensitivity.
- Default settings work well in most scenarios.
Understanding how Parabolic SAR works on charts can significantly enhance decision-making in Forex trading, offering clear insights into market momentum and potential shifts.
Advantages of Using Parabolic SAR
Clear Trading Signals
- Simple to interpret: Entry and exit points are visually straightforward.
Effectiveness in Trending Markets
- Excellently identifies and confirms trends, maximizing profit potential.
Ease of Use
- User-friendly for both beginners and seasoned traders.
Risk Management Tool
- Helps set stop-loss orders, reducing potential losses.
The Parabolic SAR indicator serves as a robust tool in a trader’s arsenal, offering clarity and precision in fast-moving Forex markets.
Practical Application in Forex Trading with Parabolic SAR
The Parabolic SAR (Stop and Reverse) is not just another indicator on your trading platform; it’s a comprehensive tool that, when used correctly, can significantly enhance your Forex trading strategy. Here’s how to make the most of it in real-world trading:
Setting Up Parabolic SAR
Platform Integration:
- Almost every trading platform includes the Parabolic SAR among its indicators. Navigate to the indicator section and select it to add it to your chart.
Customization:
- The default settings (0.02 step, 0.2 maximum) work well in general, but you might need to adjust these based on the volatility of the currency pair you’re trading. A higher step increases sensitivity, useful in a volatile market, but beware of false signals.
Interpreting Signals for Trading
Entry Points:
- Buy Signal: When the dots flip from above to below the price candles, it indicates upward momentum, suggesting a potential entry point for a long position.
- Sell Signal: Conversely, when the dots transition from below to above the price candles, it signals downward momentum, indicating a potential short-selling opportunity.
Exit Points:
- The Parabolic SAR is particularly useful for setting trailing stop losses. As the dots move, they can help you adjust your stop loss, locking in profits during a trend and exiting before a significant reversal.
Combining with Other Indicators
Trend Confirmation:
- Pair the Parabolic SAR with trend indicators like the Moving Average or the ADX to confirm the market direction. The Parabolic SAR might indicate a potential entry or exit, but confirmation from another trend indicator adds an extra layer of validation.
Spotting Reversals:
- Oscillators like the RSI or Stochastic can be useful in conjunction with the Parabolic SAR. While the Parabolic SAR indicates the trend direction, these oscillators can help spot overbought or oversold conditions, suggesting potential reversal points.
Real-Time Application
Demo Practice:
- Before applying the Parabolic SAR in live trading, practice on a demo account. This hands-on experience will help you get comfortable with the indicator and understand its behavior across different market conditions.
Risk Management:
- Begin with lower leverage to mitigate risk as you learn the nuances of the Parabolic SAR. The Forex market is unpredictable, and while the Parabolic SAR can provide valuable insights, no indicator is infallible.
Continuous Learning:
- Markets evolve, and so should your use of the Parabolic SAR. Regularly review your trades, both successful and unsuccessful, to refine your understanding and application of this versatile indicator.
By integrating the Parabolic SAR into your Forex trading strategy with a clear understanding of its signals and functionality, you’ll be better equipped to navigate the complexities of the market, making informed decisions that enhance your trading performance.
Parabolic SAR Trading Strategies
Trading with the Parabolic SAR indicator involves strategic approaches that capitalize on its strengths in identifying potential market reversals and providing clear entry and exit signals. Here are two effective strategies:
Strategy 1: Trend Continuation Signals
Objective: To capitalize on the continuation of an existing trend after a minor pullback or consolidation.
How It Works:
- Identify a Trend: Use additional trend indicators like Moving Averages to confirm the market is in a clear uptrend or downtrend.
- Wait for a Pullback: Look for the Parabolic SAR dots to temporarily show a potential reversal (dots switch sides) during a pullback or consolidation phase.
- Entry Signal: Enter a trade in the direction of the underlying trend when the dots switch back, aligning with the trend direction (below the price for an uptrend and above the price for a downtrend).
- Stop Loss: Place a stop loss at the level of the most recent Parabolic SAR dot opposite to your trade direction.
- Take Profit: Consider taking profits or trailing your stop loss as new dots form, locking in profits as the trend continues.
Strategy 2: Reversal Signals
Objective: To identify and capitalize on potential market reversals indicated by the Parabolic SAR.
How It Works:
- Market Observation: Monitor a currency pair that has been in a prolonged trend, watching for exhaustion signals like reduced volume or divergences on oscillators (e.g., RSI, MACD).
- Parabolic SAR Reversal Signal: Look for the Parabolic SAR dots to switch positions from below to above the price (for a potential downtrend reversal) or from above to below (for an uptrend reversal).
- Confirmation: Confirm the reversal with another indicator, such as a break through a moving average or a reversal candlestick pattern.
- Entry Signal: Enter the trade in the direction of the new trend as soon as the next candle opens after the confirmation.
- Stop Loss: Set a stop loss just beyond the most recent high or low before the reversal signal.
- Take Profit: Set a take profit level based on key support/resistance levels, a predetermined risk-reward ratio, or exit partially as new Parabolic SAR dots form against your position.
Key Considerations
- Risk Management: Always use proper risk management techniques, including stop losses, to protect your capital.
- Market Conditions: The Parabolic SAR performs best in markets with strong trends. In ranging or choppy markets, its effectiveness diminishes, and it may produce false signals.
- Indicator Combinations: Combining the Parabolic SAR with other indicators can improve decision-making by providing additional confirmation and reducing false signals.
- Backtesting: Before applying these strategies in live trading, backtest them on historical data to understand their effectiveness and make any necessary adjustments.
By implementing these strategies, traders can leverage the Parabolic SAR’s strengths in trend analysis and reversal identification, enhancing their trading outcomes in the Forex market.
Limitations and Considerations of Using Parabolic SAR
While the Parabolic SAR is a valuable tool for Forex traders, it’s crucial to be aware of its limitations and considerations to use it effectively. Understanding these aspects will help you mitigate risks and apply the Parabolic SAR more strategically.
Sensitivity to Market Conditions
- Trending vs. Ranging Markets: The Parabolic SAR excels in trending markets but can generate false signals in ranging or sideways markets. Its effectiveness is diminished in periods of market consolidation where price movement is minimal and directionless.
Adjustment of Parameters
- Acceleration Factor (AF): The default AF settings might not be optimal for all trading styles or market conditions. An AF that’s too high can make the indicator too sensitive, leading to premature reversal signals, while a too-low AF might lag in identifying trend changes.
Risk of False Signals
- False Reversals: Like all indicators, the Parabolic SAR is not foolproof and can produce false reversal signals, particularly in volatile markets. These false signals can lead to premature entries or exits, potentially resulting in losses.
Need for Complementary Tools
- Combination with Other Indicators: To mitigate the risks of false signals and improve the accuracy of your trading decisions, it’s advisable to use the Parabolic SAR in conjunction with other technical analysis tools, such as trend lines, moving averages, and oscillators.
Timeframe Considerations
- Different Timeframes: The Parabolic SAR can behave differently across various timeframes. On shorter timeframes, it may be more prone to producing false signals due to market noise, whereas on longer timeframes, it may provide more reliable but less frequent signals.
Psychological Factors
- Overreliance on the Indicator: There’s a risk of becoming overly reliant on the Parabolic SAR for trading decisions. It’s important to remember that no single indicator should dictate your trading strategy; instead, use it as part of a comprehensive analysis.
Experience and Practice
- Learning Curve: Effective use of the Parabolic SAR requires practice and experience. Traders should spend time learning its nuances and behavior in different market conditions to use it effectively.
Economic Events and News
- Impact of News: Economic news and events can cause significant market volatility, leading to abrupt price movements that the Parabolic SAR might not accurately reflect. Always consider the broader economic calendar and news events in your trading decisions.
By being mindful of these limitations and considerations, traders can more effectively incorporate the Parabolic SAR into their trading strategies, using it as a guide rather than a definitive signal provider. Balancing its insights with other analysis techniques and market knowledge is key to achieving trading success.
Conclusion
The Parabolic SAR is an invaluable tool in the arsenal of Forex traders, offering clear signals for entry and exit points and excelling in trending markets. Its simplicity and visual ease of interpretation make it accessible to traders of all levels, from beginners to seasoned professionals. However, like any trading tool, it comes with its limitations and is most effective when used in conjunction with other technical analysis tools and a solid understanding of market conditions.
It’s crucial for traders to be aware of the Parabolic SAR’s sensitivity to market volatility and to adjust its parameters to suit their trading style and the prevailing market conditions. The indicator’s tendency to produce false signals in ranging markets underscores the importance of complementing it with other indicators for trend confirmation and risk management.
Successful trading with the Parabolic SAR requires practice and an ongoing commitment to learning. Traders should experiment with the indicator in different market conditions and timeframes to fully understand its nuances. Additionally, staying informed about economic news and events is essential, as these can significantly impact market movements and the effectiveness of the Parabolic SAR.
In conclusion, the Parabolic SAR can be a powerful component of a Forex trading strategy when used wisely. By recognizing its strengths and limitations and integrating it into a comprehensive trading plan, traders can leverage the Parabolic SAR to navigate the complexities of the Forex market with greater confidence and success.

