Dive into the world of Forex trading, where success hinges on precision, strategy, and the right set of tools. Among these tools, trading indicators stand out, guiding traders through the complexities of market trends and decision-making. Enter the Ichimoku Cloud, a comprehensive indicator that offers a deeper insight into market dynamics. This guide unveils the Ichimoku Cloud, shedding light on how it can transform your trading approach with its unique blend of information on trend, momentum, and potential areas of support and resistance. Whether you’re a seasoned trader or just starting, understanding the Ichimoku Cloud could be the key to unlocking new opportunities in the Forex market.
Understanding the Ichimoku Cloud
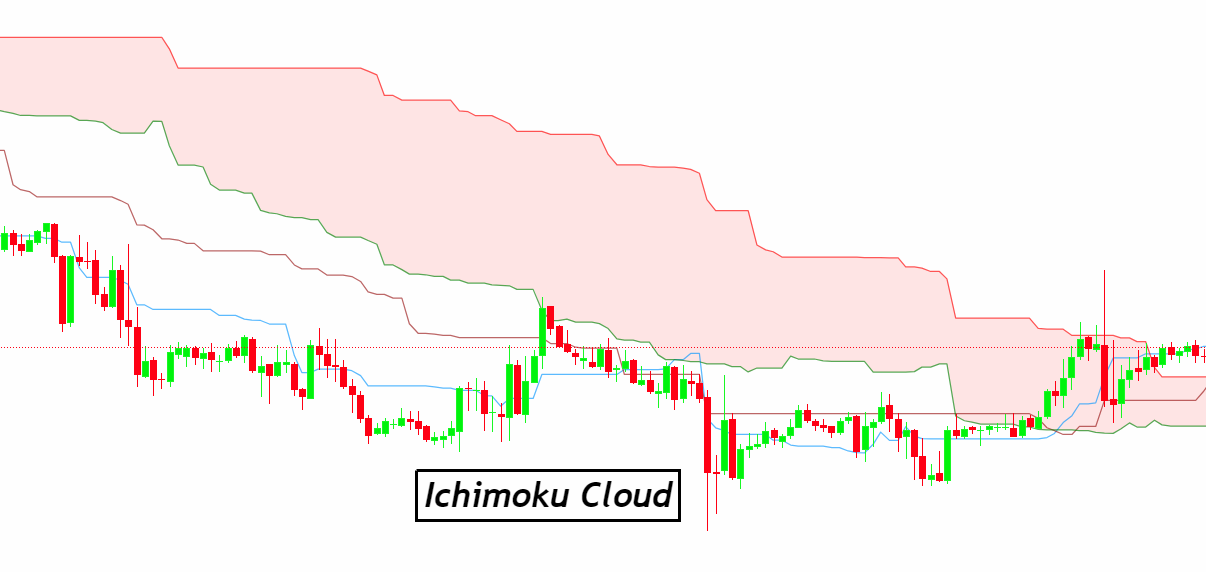
The Ichimoku Cloud, or “Ichimoku Kinko Hyo,” translates to “one look equilibrium chart,” offering traders a comprehensive snapshot of market sentiment at a glance. This unique indicator combines five main components to provide a multi-dimensional view of price action, making it a favorite among Forex traders for its depth and reliability.
Components of the Ichimoku Cloud:
- Tenkan-sen (Conversion Line): Represents the short-term trend and is calculated as the average of the highest high and the lowest low over the last 9 periods.
- Kijun-sen (Base Line): Indicates medium-term momentum, derived from the average of the highest high and the lowest low over the last 26 periods.
- Senkou Span A (Leading Span A): Forms one edge of the cloud, calculated as the average of the Tenkan-sen and Kijun-sen, plotted 26 periods ahead.
- Senkou Span B (Leading Span B): Creates the other edge of the cloud, determined by the average of the highest high and the lowest low over the past 52 periods, plotted 26 periods into the future.
- Chikou Span (Lagging Span): Shows the closing price of the current period, plotted 26 periods back, offering a historical perspective.
The space between the Senkou Span A and Senkou Span B lines forms the “cloud” or “Kumo,” which is the hallmark of this indicator. The cloud’s color changes depending on the relative position of Senkou Span A to Senkou Span B, providing a visual representation of market trends. A green cloud suggests a bullish market, while a red cloud indicates bearish conditions.
The Ichimoku Cloud’s comprehensive approach not only helps in identifying the direction and strength of trends but also in spotting potential support and resistance levels, making it an indispensable tool in a trader’s arsenal.
How to Use the Ichimoku Cloud
Using the Ichimoku Cloud in Forex trading involves setting up the indicator on your chart and interpreting its signals to make informed trading decisions. Here’s how to leverage the Ichimoku Cloud effectively:
Setting Up the Ichimoku Cloud:
- Access Your Trading Platform: Open your Forex trading platform.
- Select Ichimoku Cloud: Find the Ichimoku Cloud indicator in the platform’s indicator list.
- Apply to Chart: Add the Ichimoku Cloud to your chosen currency pair chart. The default settings typically include 9, 26, and 52 periods, reflecting the short, medium, and long-term market trends.
Reading the Signals:
- Assess the Trend: Look at the cloud (Kumo). A price above the cloud indicates a bullish trend, while a price below suggests a bearish trend.
- Watch for Crossovers: The Tenkan-sen and Kijun-sen lines crossing can signal potential trend changes. A Tenkan-sen crossing above the Kijun-sen is a bullish signal, whereas a cross below is bearish.
- Consider the Cloud’s Thickness: A thicker cloud implies stronger support or resistance, making a trend more likely to continue. A thin cloud suggests weaker support or resistance, indicating potential trend reversals.
- Observe the Chikou Span: Its position relative to the price can confirm the strength of a signal. If the Chikou Span is above the price, it supports bullish signals; below the price, it confirms bearish signals.
Practical Tips for Interpretation:
- Use in Multiple Time Frames: Apply the Ichimoku Cloud across different time frames for a more comprehensive analysis.
- Combine with Other Indicators: While the Ichimoku Cloud offers extensive insights, corroborating its signals with other indicators like RSI or MACD can enhance decision-making.
- Practice Patience: Wait for clear signals before entering or exiting trades. The Ichimoku Cloud provides a wealth of information, but it’s essential to avoid overtrading based on ambiguous signals.
Mastering the Ichimoku Cloud takes time and practice, but its comprehensive approach to capturing market dynamics makes it a powerful tool in a trader’s toolkit.
Advantages of the Ichimoku Cloud
The Ichimoku Cloud stands out in the world of Forex trading for its comprehensive approach to market analysis. Here are the key advantages of using the Ichimoku Cloud:
- Multi-Dimensional Analysis: The Ichimoku Cloud offers a unique blend of information, providing insights into price momentum, trend direction, and potential support and resistance levels all within a single glance. This holistic view enables traders to make well-informed decisions.
- Applicability to Various Time Frames: Whether you’re a day trader looking at minute charts or a long-term investor analyzing weekly trends, the Ichimoku Cloud adapts seamlessly across different time frames, making it a versatile tool for all trading strategies.
- Clarity in Trend Visualization: The cloud component of the Ichimoku system offers a clear visual representation of the market trend. A price move above the cloud indicates a bullish trend, while a move below signifies bearish conditions, simplifying trend analysis.
- Dynamic Support and Resistance Levels: The cloud’s leading spans (A and B) project support and resistance levels into the future, offering traders a roadmap of potential price movements and helping in planning entry and exit points.
- Trading Signal Diversity: The Ichimoku Cloud provides various signals (such as the Tenkan-Kijun cross, price relation to the cloud, and the Chikou Span’s position) that cater to different trading styles and preferences, offering multiple strategies within a single indicator.
- Ease of Use: Despite its complex appearance, the Ichimoku Cloud is relatively straightforward to interpret once understood, making it accessible to both novice and experienced traders.
- Enhanced Decision Making: By consolidating multiple analyses into one indicator, the Ichimoku Cloud reduces the need for numerous other indicators, streamlining the decision-making process and decluttering the trading interface.
Incorporating the Ichimoku Cloud into your trading strategy can enhance your market analysis, providing a solid foundation for making informed trading decisions. Its comprehensive nature and adaptability make it a valuable tool in the arsenal of Forex traders.
Strategies for Trading with the Ichimoku Cloud
Trading with the Ichimoku Cloud involves various strategies that cater to different market conditions and trading styles. Here are some effective strategies to consider:
Strategy 1: Trading the Tenkan-Kijun Cross
- Signal for Entry: A bullish signal occurs when the Tenkan-sen (Conversion Line) crosses above the Kijun-sen (Base Line). Conversely, a bearish signal is when the Tenkan-sen crosses below the Kijun-sen.
- Consider the Cloud: For stronger signals, ensure the crossover occurs with the price relative to the cloud in the corresponding direction (above the cloud for bullish signals, below for bearish signals).
- Exit Strategy: Consider exiting the trade when the Tenkan-sen crosses back in the opposite direction or use the Kijun-sen as a trailing stop.
Strategy 2: Using the Cloud for Trend Following
- Identify the Trend: Look at the cloud’s color and the price’s position relative to the cloud. A price above a green cloud indicates a strong uptrend, while a price below a red cloud suggests a strong downtrend.
- Entry Points: Enter long positions when the price moves above the cloud during an uptrend. For downtrends, consider short positions when the price falls below the cloud.
- Exit or Reversal: Consider exiting or taking opposite positions when the price crosses to the other side of the cloud, indicating a potential trend reversal.
Strategy 3: Breakouts and Reversals with the Cloud
- Spotting Breakouts: Watch for the price breaking through the cloud, which can indicate a strong momentum shift and a potential new trend.
- Confirmation: Use the Chikou Span as a confirmation tool. A Chikou Span breaking above past price action confirms a bullish breakout, while breaking below confirms a bearish breakout.
- Reversal Signals: A thinning cloud approaching a price crossover may indicate weakening support or resistance, suggesting a potential reversal. Confirmation from the Tenkan-sen and Kijun-sen crossover can strengthen the reversal signal.
Common Practices for All Strategies:
- Use Stop Losses: Always set stop losses to manage risk effectively, potentially using the cloud or the Kijun-sen as reference points.
- Confirm with Other Indicators: Validate Ichimoku signals with other indicators, such as RSI or MACD, for added confirmation.
- Be Patient: Wait for clear, confirmed signals before executing trades. The Ichimoku Cloud provides a wealth of information, and acting on strong signals can help in maintaining a disciplined trading approach.
By incorporating these strategies, traders can utilize the full potential of the Ichimoku Cloud to navigate the Forex market with greater confidence and precision.
Common Mistakes to Avoid
When trading with the Ichimoku Cloud, it’s crucial to be aware of common pitfalls that can hinder performance. Avoiding these mistakes can enhance your trading strategy:
Over-Reliance on a Single Indicator:
- Balance Your Analysis: While the Ichimoku Cloud offers a comprehensive view, relying solely on it without considering market context or other indicators can lead to missed signals or false positives.
Ignoring the Bigger Picture:
- Consider Multiple Time Frames: Focusing only on short-term signals without acknowledging the broader trend can result in trades that go against the main market direction, increasing risk.
Misinterpreting the Cloud’s Signals:
- Wait for Confirmation: Acting on incomplete signals, such as entering a trade before a crossover is fully confirmed, can lead to premature decisions.
- Understand the Cloud’s Thickness: A thin cloud might not provide strong support or resistance, whereas a thick cloud indicates stronger levels that are more likely to hold.
Neglecting Volume and Other Confirmatory Indicators:
- Check Volume: Confirm Ichimoku signals with trading volume; higher volume on signal confirmation can indicate stronger momentum.
- Use Additional Indicators: Complement Ichimoku signals with other technical analysis tools like RSI, MACD, or Stochastic Oscillators for a more rounded analysis.
Overtrading:
- Be Selective: The Ichimoku Cloud can generate many signals, but not all are worth acting on. Filter signals based on their strength and the current market context to avoid excessive trading.
Not Adapting to Market Conditions:
- Stay Flexible: The effectiveness of Ichimoku Cloud signals can vary under different market conditions. Be ready to adjust your strategy in response to changing market dynamics.
Disregarding Risk Management:
- Implement Risk Controls: Always use stop-loss orders and manage your trade sizes to ensure that you’re not exposing yourself to undue risk on a single trade.
By being mindful of these common mistakes and incorporating best practices in your trading strategy, you can more effectively leverage the Ichimoku Cloud to navigate the complexities of the Forex market.
Conclusion
In conclusion, the Ichimoku Cloud stands as a robust and versatile tool in the arsenal of Forex traders, offering a unique blend of insights into market trends, momentum, and potential support and resistance levels. Its comprehensive nature allows traders to make informed decisions by providing a clear visual representation of the market’s current state and future direction.
Mastering the Ichimoku Cloud requires understanding its components, interpreting its signals accurately, and integrating its insights with a well-rounded trading strategy. While it offers numerous advantages, including adaptability across different time frames and the ability to generate a variety of trading signals, traders must avoid common pitfalls such as over-reliance on the indicator, ignoring market context, and neglecting risk management principles.
As with any trading tool, the key to success lies in disciplined practice, continuous learning, and the integration of the Ichimoku Cloud with other technical analysis tools for confirmation. By doing so, traders can enhance their market analysis, make more informed trading decisions, and navigate the Forex market with greater confidence and effectiveness.
We encourage traders to experiment with the Ichimoku Cloud on a demo account, refine their strategies, and share experiences with the trading community. As you gain proficiency, the Ichimoku Cloud can become an invaluable component of your trading approach, helping to illuminate the path through the complex and dynamic world of Forex trading.

