Definition:
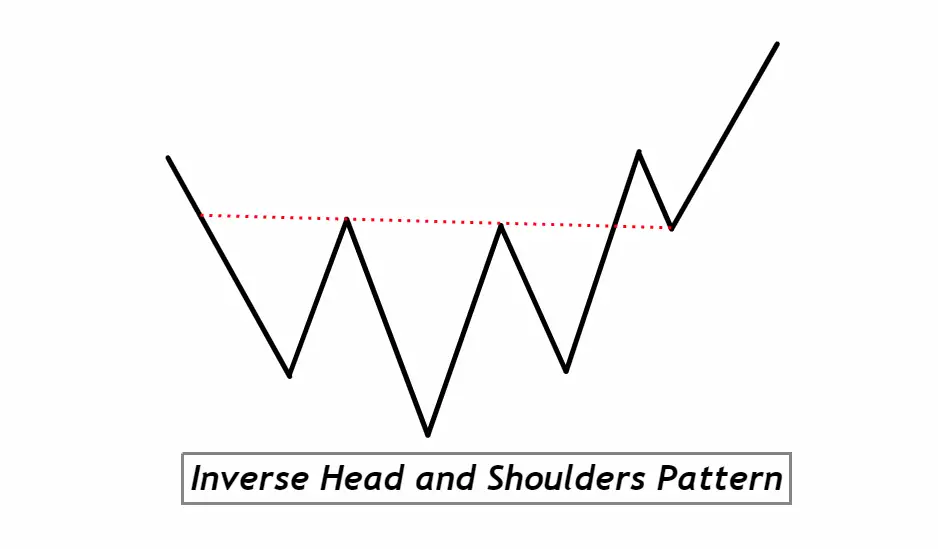
The inverse head and shoulders pattern is a bullish chart formation that signifies a potential reversal of a downtrend, characterized by three troughs with the middle trough being the deepest. Often observed in technical analysis, the inverse head and shoulders pattern serves as a reliable indicator of an upcoming bullish momentum, signaling traders to potentially anticipate upward price movements.
Identifying the Inverse Head and Shoulders Pattern on a Chart:
- Prior Downtrend: Before the formation begins, there should be an existing downtrend in place. This provides the context for a potential bullish reversal.
- Left Shoulder: The first trough, or the ‘left shoulder’, forms when the price drops to a new low and then rises.
- Head Formation: After the left shoulder, the price will decline again, reaching a lower low than the left shoulder, forming the ‘head’. This is the deepest trough of the pattern.
- Right Shoulder: Subsequent to the head, the price will rise and then make another trough. This ‘right shoulder’ is typically shallower than the head but can be at a similar level to the left shoulder.
- Neckline: Draw a line connecting the peaks formed after each of the three troughs (post-left shoulder, post-head, post-right shoulder). This is known as the ‘neckline’. It can be horizontal or slightly slanted.
- Volume: Though not always present, ideal formations might show declining volume during the formation of the pattern and an increase in volume as the price breaks above the neckline.
- Breakout: Confirmation of the pattern is achieved when the price breaks above the neckline after forming the right shoulder. This breakout often comes with an increase in trading volume.
Significance and Indications of the Inverse Head and Shoulders Pattern:
- Reversal Signal: At its core, the inverse head and shoulders pattern is one of the most widely recognized reversal formations in technical analysis. When spotted after a prolonged downtrend, it suggests that the market sentiment is shifting. The consecutive higher lows of the left shoulder, head, and right shoulder indicate that sellers are losing momentum and buyers are starting to step in, setting the stage for a potential upward trend.
- Psychological Insight: The formation encapsulates a tug-of-war between buyers and sellers. The head, being the lowest point, represents a climax of selling pressure. As the price starts to rebound and form the right shoulder, it’s an indication that the bears (sellers) are running out of steam, and bulls (buyers) are gaining control. When the price breaks above the neckline, it confirms that the bulls have won this particular battle, suggesting a further increase in bullish momentum.
- Measurable Targets: For traders, the pattern offers a measurable target for potential profit. The vertical distance between the head’s bottom and the neckline can be projected upwards from the breakout point, giving traders an approximate target for the ensuing bullish move. This predictive aspect allows traders to set clear price objectives and manage their risk-to-reward ratios effectively.
- Increased Reliability with Volume: Volume analysis can enhance the reliability of the pattern. Declining volume during the formation, followed by a noticeable increase as the price breaks the neckline, adds credibility to the breakout. It’s a testament that the bullish move is backed by a strong buying interest, thereby boosting the confidence of traders in the sustainability of the new uptrend.
In essence, the inverse head and shoulders pattern is not just a visual representation of price movements, but a narrative of shifting market dynamics. For new traders, mastering the recognition and interpretation of this pattern can offer valuable insights into potential trend reversals and profitable trading opportunities.
Activity of Big Traders During the Formation of the Inverse Head and Shoulders Pattern:
- Accumulation Phase: The formation of the left shoulder and the subsequent head often correlates with an accumulation phase by big traders or institutions. After a prolonged downtrend, these market movers see value in the underlying asset and begin to accumulate positions, but the broader market sentiment is still predominantly bearish. This accumulation can arrest the decline and cause the initial rebound forming the left shoulder.
- Selling Exhaustion: The descent to form the head can be seen as the last gasp of the bears (sellers) in the market. While the price drops lower than the left shoulder, it doesn’t stay there for long. This is often because the smart money (big traders) sees this as an even better buying opportunity and intensifies their accumulation. The deep trough of the head can be indicative of selling exhaustion – where the majority of weak hands or panic sellers have been shaken out of the market.
- Confirmation and Participation: As the price rises to form the right shoulder, big traders are likely continuing their accumulation, albeit more cautiously. They’re watching for signs of confirmation that the trend is about to reverse. The breakout above the neckline is a significant signal. When this happens with a surge in volume, it often means that not only are big traders pushing the price, but they’ve also instilled confidence in the broader market, prompting other traders to jump in, thereby accelerating the bullish momentum.
- Positioning Ahead of the Crowd: By the time many retail traders recognize the inverse head and shoulders pattern and act on it, big traders are already well positioned. Their early accumulation during the pattern’s formation means they benefit the most from the ensuing uptrend. This is why understanding the underlying dynamics of the pattern, and not just its visual representation, can be beneficial for retail traders. It offers clues about where the smart money is moving.
In conclusion, behind the formation of the inverse head and shoulders pattern is a subtle narrative of big traders gradually shifting the balance of power in the market. For the informed retail trader, recognizing these dynamics can provide an edge, allowing them to ride the waves created by the market’s biggest participants.
Confirmation Tools for the Inverse Head and Shoulders Pattern
| Tool | Description |
|---|---|
| Key Levels | Before entering based on the pattern, it’s important to consider other key levels on the chart, such as historic resistance or support levels. If the pattern’s neckline coincides with a significant historic resistance level, a breakout would be even more significant. |
| Break of Low After Pattern Formation | After the pattern completes and price breaks the neckline, monitor if the price tests the pattern’s lows (especially the head) without breaking below. A successful retest that doesn’t breach the head’s low can serve as a powerful confirmation. |
| Volume Surge | Volume is a critical component for confirming the pattern. A noticeable increase in volume during the neckline breakout suggests strong buying interest and adds credibility to the pattern’s bullish signal. A sustained volume increase on subsequent trading days further solidifies the breakout’s validity. |
| Technical Indicators | Leveraging momentum indicators, such as the Relative Strength Index (RSI) or the Moving Average Convergence Divergence (MACD), can offer additional insights. For instance, bullish divergence on the RSI (where price makes lower lows, but RSI makes higher lows) during the formation can hint at waning selling momentum and bolster the pattern’s reversal signal. |
Armed with these confirmation tools, traders can increase their confidence in the inverse head and shoulders pattern and make more informed decisions. Always remember, however, that while these tools enhance the probability of success, no single strategy or set of tools guarantees profit in trading. Proper risk management is always paramount.
Trading the Inverse Head and Shoulders: Key Insights
- Best Timeframe: While the inverse head and shoulders pattern can form on any timeframe, it’s often more reliable on longer timeframes, such as the daily or weekly charts. Longer timeframes tend to filter out the ‘noise’ of short-term price fluctuations, yielding patterns with higher significance.
- Trading Session: The pattern’s reliability can be enhanced when observed during the main trading sessions for the asset in question. For forex, for instance, it’s beneficial to consider patterns formed during the London or New York sessions, given their higher liquidity and volume.
- Winning Ratio: No pattern offers a guaranteed win-rate, but when traded with discipline and combined with other confluence factors, the inverse head and shoulders can offer an approximate winning ratio of 60-70%. However, this can vary based on the market, the trader’s experience, and the use of other confirmation tools.
Inverse Head and Shoulders Trading Strategy with Confluence
- Entry Point: The primary entry point following this pattern is upon a confirmed breakout above the neckline. To add confluence, ensure that the breakout is accompanied by one or more of the following:
- A surge in volume.
- A bullish candlestick pattern (e.g., a strong bullish engulfing pattern).
- Alignment with key Fibonacci levels or significant historical support/resistance.
- Stop Loss: Position the stop loss just below the right shoulder, ensuring it’s not too tight to avoid getting stopped out by minor price retracements. If you want an even more conservative approach, you can place the stop loss below the head, but this will increase your risk and might require adjusting your position size.
- Take Profit Level: Calculate the vertical distance between the head’s bottom and the neckline (known as the pattern’s “height”). Project this distance upwards from the breakout point to get an approximate target. However, always be mindful of key resistance levels ahead, and consider taking partial profits or moving your stop loss to break even when significant levels are approached.
Conclusion
The inverse head and shoulders pattern is a powerful and classic reversal signal that traders have relied on for decades. When combined with additional confluence factors, its efficacy is enhanced, offering traders a structured approach with clear entry and exit points. Nonetheless, while it serves as a robust tool in a trader’s arsenal, the importance of risk management and continuous market analysis cannot be overstated. Successful trading is a blend of pattern recognition, discipline, and ongoing learning.

