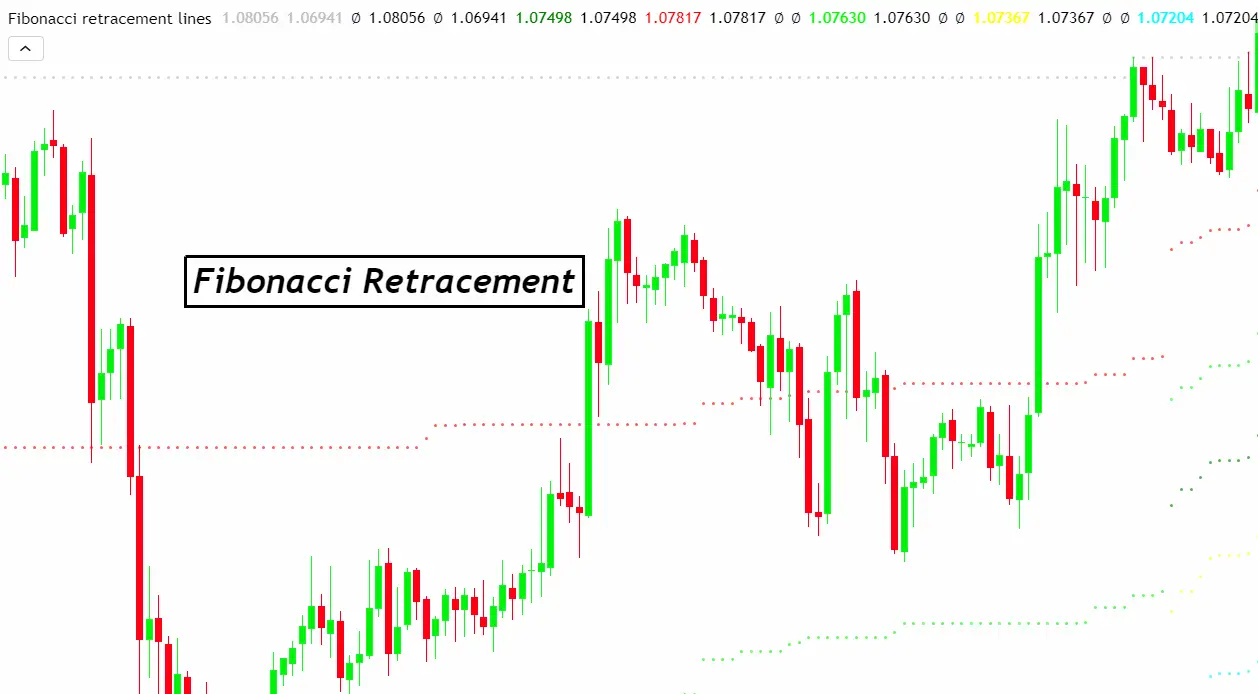
Fibonacci Retracement stands as a pivotal tool in the world of forex trading, guiding traders through the waves of market trends with precision and reliability. Originating from an ancient mathematical sequence, this indicator not only traces price reversals but also forecasts potential support and resistance levels with uncanny accuracy. Essential for those aiming to sculpt their trading strategies with depth and foresight, Fibonacci Retracement offers a lens through which the market’s ebb and flow become predictable, turning the chaos of currency movements into a landscape ripe with opportunity. Embrace this tool, and you unlock a new dimension in forex trading, where informed decisions lead to calculated success.
Understanding Fibonacci Retracement
Fibonacci Retracement hinges on a fascinating numerical sequence discovered by Leonardo Pisano Bogollo, an Italian mathematician. Each number in this sequence is the sum of the two preceding ones, starting from 0 and 1. But how does this relate to forex trading? The magic unfolds as these ratios transform into key retracement levels: 23.6%, 38.2%, 50%, 61.8%, and sometimes 78.6%.
Traders draw these levels over a price chart, marking potential points where the market might pause or reverse. These are not mere numbers; they represent psychological points of interest for a multitude of traders, thus influencing market movements. By applying Fibonacci Retracement to a high and low point on a chart, traders can anticipate and react to possible retracement levels, making it an indispensable tool in their strategic arsenal.
Why Use Fibonacci Retracement in Forex Trading?
Identifies Key Support and Resistance Levels
- Pinpoints where prices might halt and reverse.
- Offers clear entry and exit points.
Enhances Risk Management
- Aids in setting stop-loss and take-profit levels.
- Improves trade’s risk-to-reward ratio.
Versatile Across Time Frames
- Effective in short-term and long-term analyses.
- Adaptable to various trading styles.
Combines with Other Indicators
- Strengthens strategies when used with other tools.
- Provides confirmation for trades.
Widely Recognized
- Utilized by a vast community of traders.
- Creates self-fulfilling prophecies due to collective attention.
Incorporating Fibonacci Retracement into forex trading equips traders with a deeper understanding of market dynamics, offering a blend of historical significance and practical utility.
How to Draw Fibonacci Retracement Levels
Drawing Fibonacci Retracement levels accurately is crucial for their effectiveness in forex trading. Follow these steps to ensure precision:
1. Identify the Trend
- Find a significant movement in the market, either upward or downward.
2. Select the Fibonacci Retracement Tool
- Most trading platforms include this tool in their charting software.
3. Place the Tool at Swing Points
- For an uptrend, anchor the tool at the swing low and drag it to the swing high.
- For a downtrend, start at the swing high and pull down to the swing low.
4. Observe the Retracement Levels
- The tool automatically displays key levels: 23.6%, 38.2%, 50%, 61.8%, and sometimes 78.6%.
5. Analyze Price Action
- Watch how prices interact with these levels, looking for signs of support or resistance.
By carefully applying these steps, traders can utilize Fibonacci Retracement levels to navigate the forex market with enhanced insight and strategy.
Key Fibonacci Levels and Their Significance
Fibonacci Retracement levels are pivotal markers that indicate potential reversal points in the forex market. Here’s a breakdown of the most crucial levels and what they signify:
23.6% Level
- Represents a minor retracement.
- Suggests a strong trend if prices bounce from this level.
38.2% Level
- Often seen in shallow retracements.
- Holding above or below this level indicates the strength of the underlying trend.
50% Level
- Not a true Fibonacci ratio, yet widely observed.
- Acts as a psychological midpoint, offering a strong support or resistance area.
61.8% Level (Golden Ratio)
- Considered the most significant retracement level.
- A reversal here indicates a potential return to the original trend.
78.6% Level
- Deeper retracement, hinting at a weaker trend.
- Breaching this level might suggest a trend reversal.
Traders closely monitor these levels, integrating them into their strategies to predict price movements and make informed decisions. Each level’s reaction helps assess market sentiment and potential directional changes in currency pair prices.
Tips for Using Fibonacci Retracement Effectively
Combine with Other Indicators
- Enhance accuracy by using with trend lines, moving averages, or RSI.
Wait for Confirmation
- Look for candlestick patterns or momentum indicators to confirm reversals.
Apply to Clear Trends
- Use on well-defined market swings for best results.
Adjust to Market Context
- Adapt levels based on recent market volatility and trends.
Be Flexible with Levels
- Treat Fibonacci levels as zones rather than precise points.
Practice Patience
- Allow the market to reach and react to these levels before trading.
Implementing these tips can significantly improve your trading decisions and the effectiveness of Fibonacci Retracement in your forex trading strategy.
Common Mistakes to Avoid with Fibonacci Retracement
Ignoring the Overall Trend
- Failing to align Fibonacci levels with the market’s primary direction can lead to misguided trades.
Overreliance on Fibonacci Alone
- Depending solely on Fibonacci Retracement without other confirmatory signals may result in less accurate trading decisions.
Incorrect Placement of Levels
- Misidentifying swing highs and lows can skew Fibonacci levels, impacting their effectiveness.
Lack of Patience
- Acting hastily before price action confirms a reversal at a Fibonacci level can lead to premature trades.
Ignoring Key Price Levels
- Overlooking significant support and resistance levels outside of Fibonacci can miss crucial market cues.
Avoiding these mistakes enhances the strategic application of Fibonacci Retracement in forex trading, leading to more informed and potentially successful trades.
Integrating Fibonacci Retracement with Other Trading Tools
To maximize the effectiveness of Fibonacci Retracement in forex trading, integrate it with other analytical tools. This approach provides a more comprehensive market view and enhances decision-making:
Trend Lines
- Confirm Fibonacci support or resistance with trend line breakouts or bounces.
Moving Averages
- Use moving averages to identify the overall trend direction. Fibonacci levels aligned with moving averages strengthen support or resistance signals.
RSI (Relative Strength Index)
- Combine with RSI to identify overbought or oversold conditions at Fibonacci levels, signaling potential reversals.
MACD (Moving Average Convergence Divergence)
- Look for MACD crossovers or divergences at key Fibonacci levels for additional entry or exit signals.
Candlestick Patterns
- Confirm Fibonacci retracement levels with bullish or bearish candlestick patterns, indicating potential reversals.
By integrating Fibonacci Retracement with these tools, traders can confirm their hypotheses, reduce false signals, and execute trades with higher confidence.
Real-Life Examples of Fibonacci Retracement in Action
Example 1: Bullish Reversal
- During a downtrend, a currency pair finds support at the 61.8% Fibonacci level.
- A bullish engulfing candlestick pattern forms at this level, indicating a potential reversal.
- The RSI moves above 30, suggesting the end of oversold conditions.
- Traders enter long positions, targeting the next Fibonacci level or recent high as an exit point.
Example 2: Bearish Reversal
- In an uptrend, a currency pair struggles to break past the 38.2% Fibonacci resistance level.
- A bearish pin bar appears, signaling a potential reversal.
- MACD shows a bearish divergence at this level.
- Traders initiate short positions, setting stop losses above the recent swing high and aiming for lower Fibonacci levels or a significant support zone.
These examples illustrate how Fibonacci Retracement, combined with other indicators and patterns, can guide traders in identifying entry and exit points, managing risk, and capitalizing on market reversals.
Conclusion
Fibonacci Retracement emerges as a cornerstone tool in forex trading, offering a unique blend of mathematical precision and market psychology. By identifying crucial support and resistance levels, it empowers traders to navigate the ebb and flow of currency markets with increased confidence. Integrating Fibonacci Retracement with other technical indicators and adhering to sound trading practices amplifies its efficacy, turning it into an indispensable asset for informed decision-making.
Remember, success in forex trading doesn’t solely hinge on the tools you use but also on how effectively you apply them within a disciplined trading strategy. Fibonacci Retracement, when used wisely, can be a gateway to recognizing market patterns, managing risks, and seizing opportunities in the dynamic world of forex.
Embrace this tool, refine your approach, and you may find your trading strategies reaching new heights of precision and profitability.

