Definition
The drop base drop is a supply and demand trading pattern in which two bearish impulsive waves and retracement waves form in a specific sequence that represents the supply zone. The supply zone denotes the presence of institutional pending sell orders.
DBD denotes the drop base drop in the trading. This pattern is a price action pattern, and retail traders use DBD to analyze the footprints of market makers.
Real money follows market makers only because central banks or institutional traders influence more than 90% of the forex market. That’s why they control the money, and we can generate profit only by following them.
How to identify the drop base drop pattern in forex?
There are two ways to identify the DBD pattern on the price chart. In the first method, we analyze the drop base drop pattern using the candlesticks, while in the second method, we will use the price waves to find out the DBD price pattern. Both ways identify the same pattern, but there is only a difference in the timeframe of the price chart.
Let’s understand the first method.
Method 1: Use candlesticks
The drop base drop pattern consists of two big bearish candlesticks and one or more base candlesticks. The base candlestick is sandwiched between the two big bearish candlesticks in the image below.
You should follow a few requirements before identifying a perfect drop base drop price pattern because professional traders have adjusted these requirements to pick only high probability trade setups and filter the market noise.
Rules are following
Big bearish candlestick: The body-to-wick percentage of a big candlestick should be greater than 60%. It should have smaller wicks/shadows compared to the body of the candle.
Base candlestick: The body-to-wick ratio of the base candlestick should be less than 30%. It should have large wicks/shadows with a smaller body.
The sequence of candlesticks should be in the following manner:
Big bearish candlestick, Base candlesticks, Big bearish candlestick
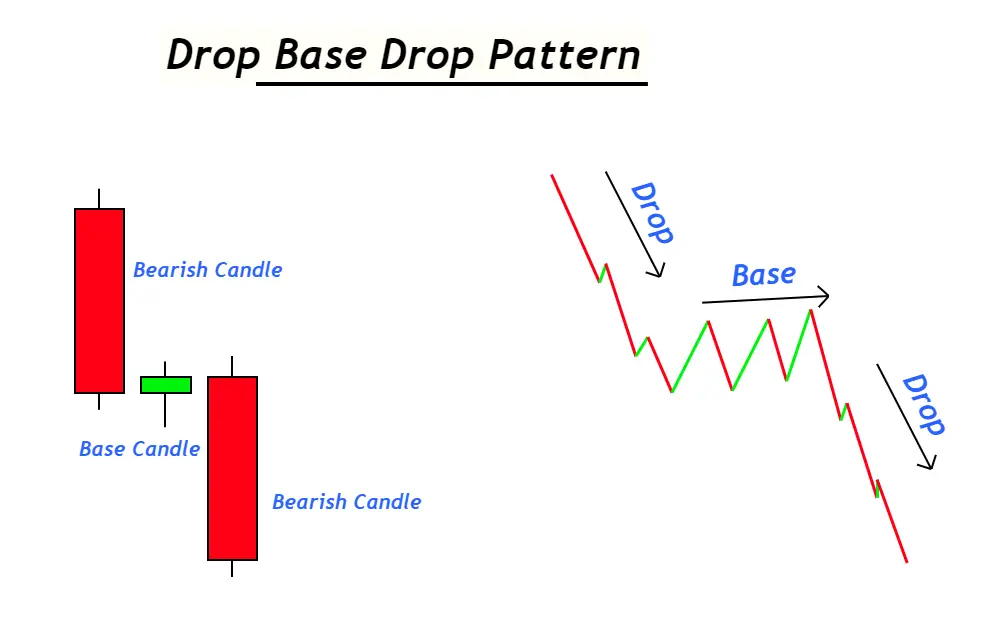
Method 2: using price waves
This method is for advanced traders, those who know the market structure. A higher timeframe candlestick is simply a chart pattern on the lower timeframe. For example, a big bullish candlestick on a daily timeframe will represent a bullish impulsive wave on the lower timeframe. In the same way, a big bearish candlestick on a higher timeframe indicates a bearish impulsive trend on the lower timeframe.
The best and most accurate method is to use the candlesticks to identify the drop base drop supply zone.
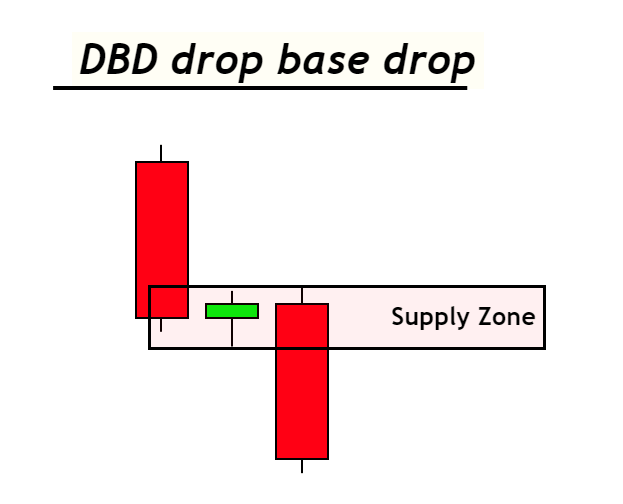
How to draw drop base drop supply zone?
Price always moves from one price range to another price range in the form of impulsive price waves like compression and rarefactions in nature.
In the DBD pattern, the big candlestick indicates an impulsive wave, and the base candlestick shows the price range.
So, we will draw the zone on the base candlestick using the high and low of the base candlesticks. Here is the simple procedure:
- Mark the high point and low point of base candlesticks and then draw a zone using these two points. Then extend the zone to the right.
- If the low of the first big bearish candlestick is lower than the base candles, then use the bearish candlestick’s low point to draw the zone.
- If the high of the last big bearish candlestick in DBD is higher than the base candles, then use this high to draw the supply zone.
You can also check this supply and demand zone indicator to automatically identify the high probability zones without spending time on these rules.
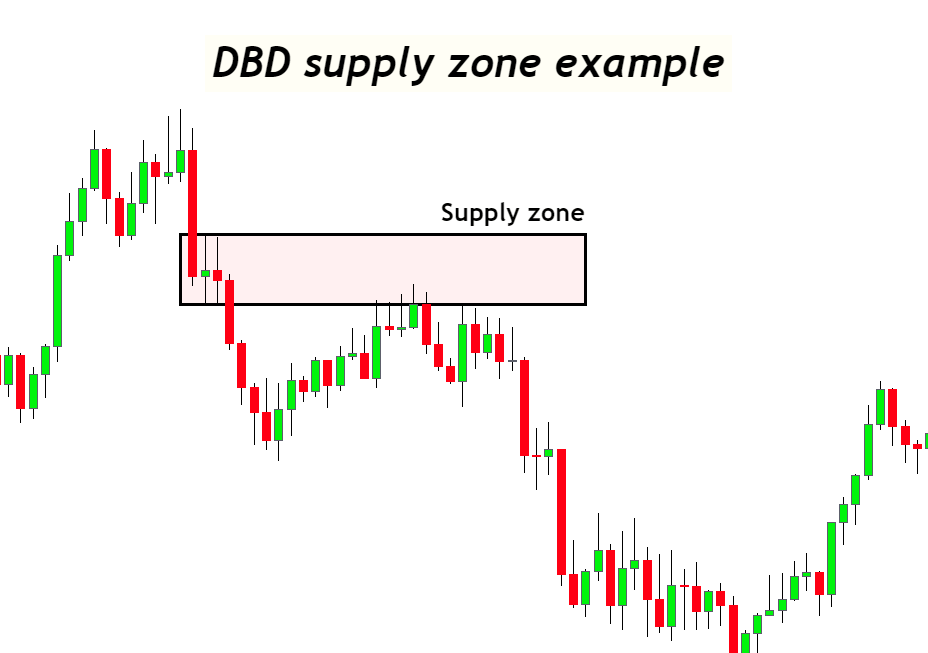
What does the drop base drop supply zone tell traders?
The drop base drop trading pattern tells retail traders that the institutional traders and banks have placed their pending orders at the supply zone. When the pending sell orders of market makers fill, the price will start a bearish trend.
This price pattern reveals the footprints of market makers. That’s why prices always return to the DBD zone to pick up pending orders of institutions to start a new bearish trend.
Keep in mind that market makers don’t want you to make a profit from the forex market. But you can earn profit only following them.
Supply zone trading strategy
These supply zones offer very high-risk reward trade setups in trading. That’s why such a price pattern helps manage the risk in trading and increases the portfolio size.
We will only place sell trades in the drop base drop pattern because it is a supply zone that represents sellers. If you want to place a buy trade, you should look for a demand zone.
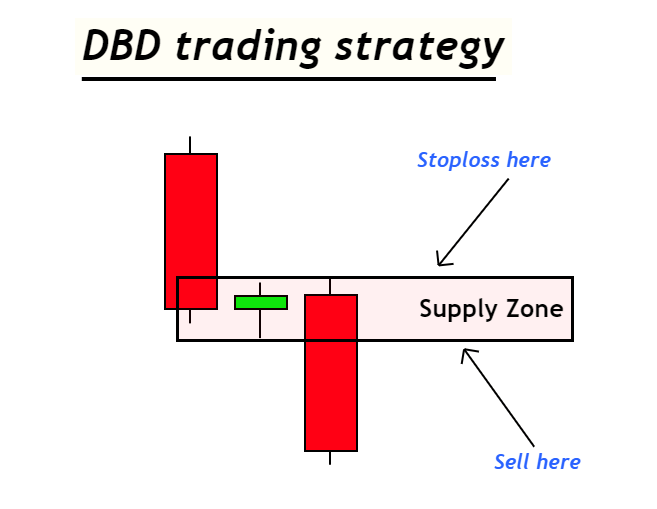
Open a Sell trade
When price forms a DBD pattern, open a pending sell limit order below the supply zone. Place stop loss a few pips above the high of the zone.
Unfortunately, the supply zone does not tell us about the take-profit levels. You can use other technical tools like chart patterns and key levels to find profit levels.
The bottom line
Trading is all about increasing the probabilities. One method to increase the probability of winning in trading is by using a confluence of three or more technical tools before taking a trade.
You can also automate your trading strategy by using this supply and demand indicator because it will save a lot of your time and help you make better decisions.

