Definition
Rally base drop is a price pattern that indicates the formation of a supply zone on the candlestick chart of a financial asset or currency pair. It consists of a big bullish candlestick, one or more doji candlesticks and a big bearish candlestick.
Supply and demand zone is a price action method that shows retail traders the footprints of the market makers on the price chart. These footprints can be used to forecast the market. There are also many other benefits of supply or demand zones, like pinpoint entry, high-risk reward and tight stop loss. These parameters are necessary for profitable trading.
How to identify a rally base drop pattern?
There are two methods to determine the rally base drop pattern on the chart. Both are almost the same, but they will look different.
The first method uses candlesticks to determine the RBD (rally base drop) pattern, while the second method involves using price waves. The psychology behind each method is the same.
If you’re a beginner trader, you should only focus on the first method. However, advanced traders should also learn the second method to dive deep into the price action.
Use of candlesticks (method 1)
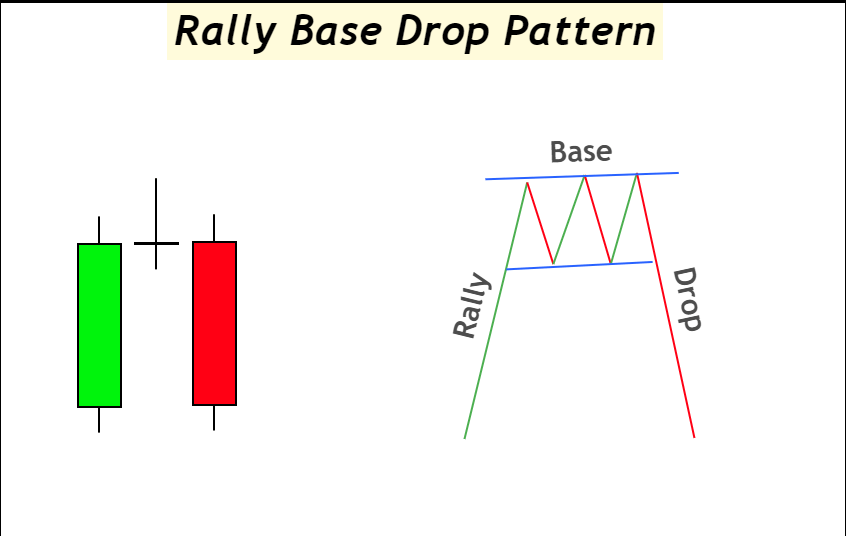
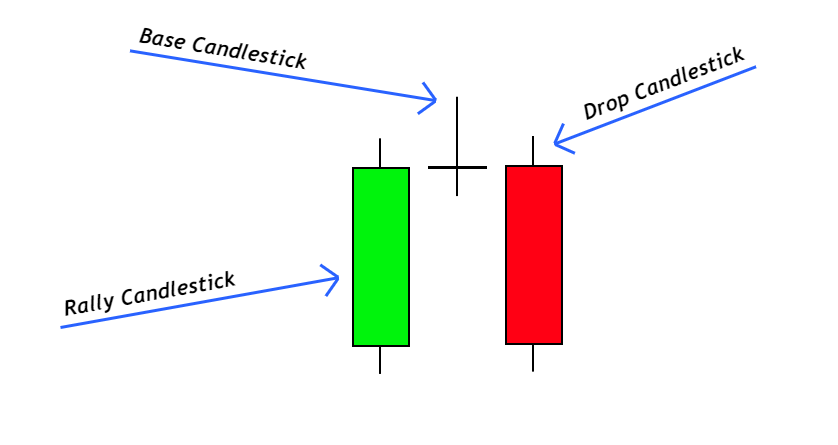
A rally base drop has three parts rally, base and drop. The rally, in simple words, represents a big bullish candlestick, while the drop indicates a big bearish candlestick. At the same time, the base combines one or more small candlesticks with a small body and large shadows.
This pattern must form in the following sequence.
Big bullish candlestick + base candlestick + big bearish candlestick
When candlesticks form like in the above sequence, it means a supply zone has been formed on the price chart. Now traders will pick pending sell orders from the supply zone, and a bearish trend will start.
Use of price waves (Method 2)
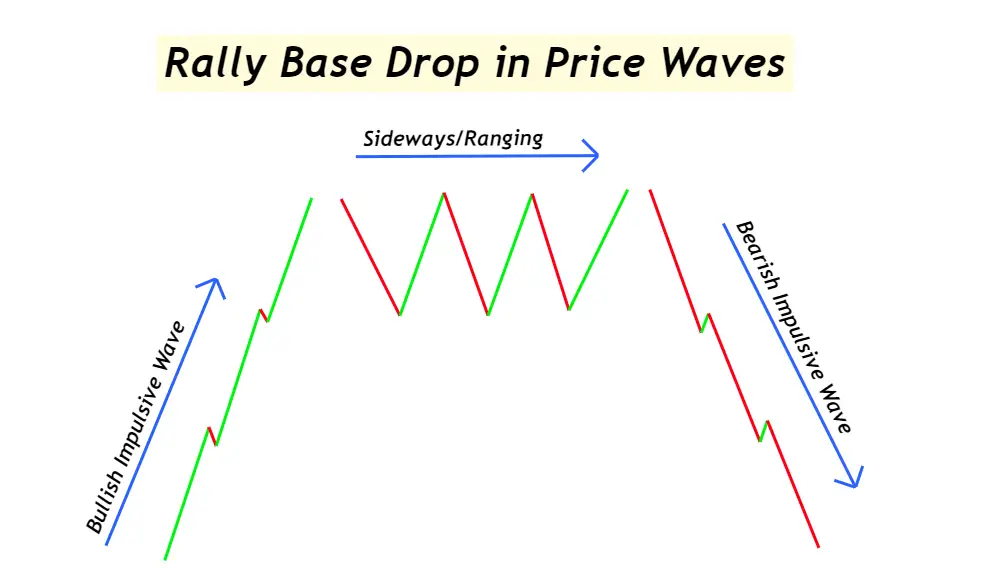
In this method, you must understand the concept of impulsive waves and retracement waves. In short, an impulsive wave shows the very high momentum of buyers/sellers on the candlestick chart, while a retracement indicates the low momentum of buyers/sellers in the market.
So here, you will have to find waves instead of candlesticks. Finding a wave is a complicated process on a candlestick chart. That’s why this method is for advanced traders. In this method, a rally means a bullish impulsive wave, while a drop means a bearish impulsive wave. In comparison, base means sideways market or ranging market.
Price will follow the following pattern during rally base drop formation:
A bullish impulsive wave + sideways/ranging market + a bearish impulsive wave
Look at the image below for a better understanding of this price pattern.
How to trade the rally base drop?
At the beginning of the article, I said that the RBD pattern is used to draw the supply zone. And Supply zone shows the presence of sellers that are willing to sell a specific currency pair or financial asset.
So the simple strategy here is to sell from the supply zone with the market makers and big institutions. After RBD pattern formation, the price will return to the supply zone to pick pending sell orders of market makers. Then after the sell order filling, the price will continue its bearish trend.

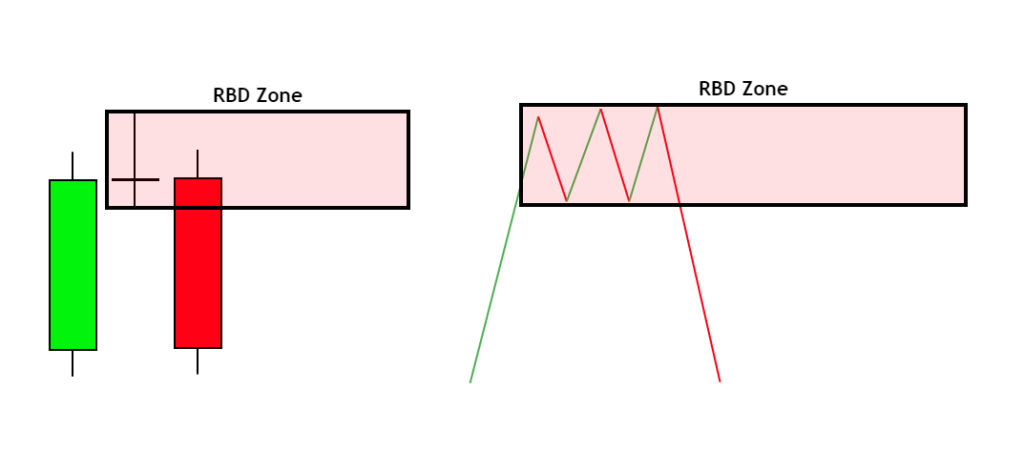
How to draw a supply zone in RBD?
Finding a supply zone is very simple in the RBD price action pattern. The base candlestick or ranging market region in the Rally base drop pattern is used to draw the supply zone.
High and low of the Base candlestick/range will act as two parameters to draw a zone on the price chart.
In case of more than one base candlestick, you should always pick the highest and lowest price points to draw the zone.
What does the rally base drop pattern tell retail traders?
There is always a reason behind the formation of every price action pattern on the candlestick chart because these patterns predict the activity of traders behind the chart.
An advanced price action trader can predict the activity of traders behind the chart by just looking at the chart. The rally base drop pattern shows sellers willing to sell from the supply zone. There’s the accumulation of pending sell orders in the supply zone. And the price will always come to fill these sell orders to make a new bearish trend.
So we aim to sell from the supply zone and ride the bearish trend with market makers.
The bottom line
I will always recommend reading the price before trading. Reading the price is the best way to determine the activity of traders behind the chart. Then you’ll be able to predict the direction of big market trends. Riding the trend is the goal of a retail trader to make high profits from the market.
Price action is the key to winning in trading.

Is there a way to distinguish which candlesticks qualify as a rally or a drop or just that they’re larger than the rest?