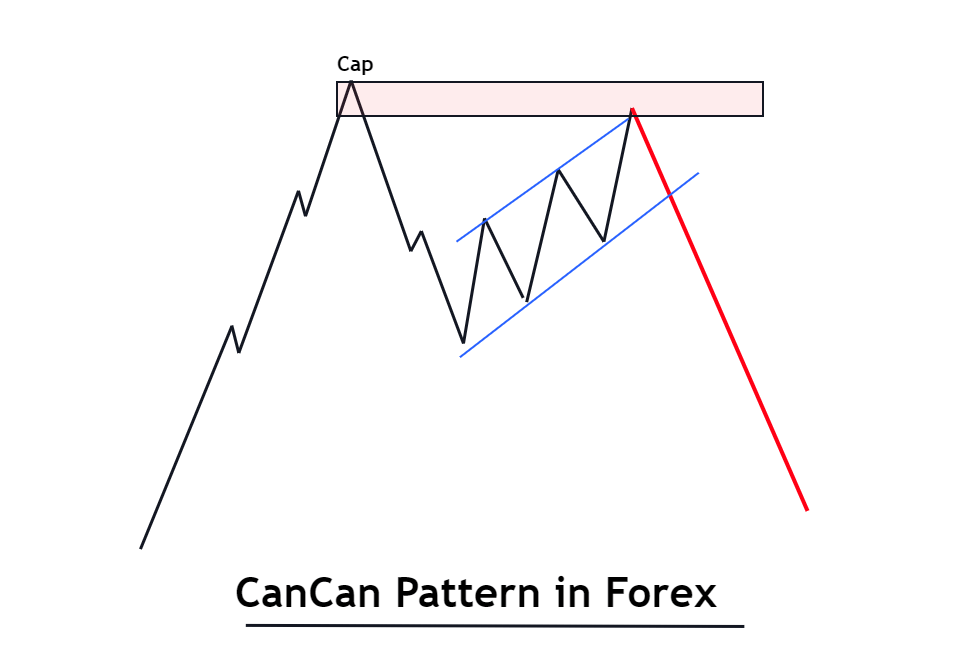
The CanCan is a market pattern in which price makes a pole and then comes back within the pole, creating many unfilled orders at the top of the pole. The price will return to the top of the pole to pick up those unfilled orders to continue the bearish trend.
Retail traders use the reversal chart patterns to predict the market. The cancan is one of the reversal chart patterns like the Quasimodo pattern. It is used in combination with flag limit and ftr.
I will explain the cancan pattern with a price action trading strategy.
How to identify the CanCan pattern in forex trading?
Before understanding the cancan pattern, you must learn about the pole and flag pattern.
The pole represents the impulsive price wave with high momentum, while the flag pattern shows the price retracement on the candlestick chart. Look at the image below for a better understanding of this pattern.
You can Identify the cancan pattern consists of the following steps:
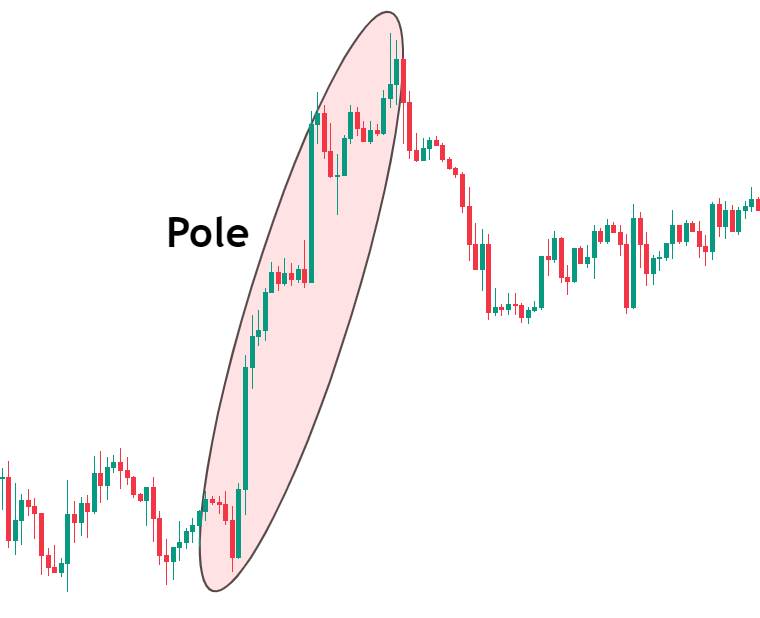
In the first step, a pole will form, breaking the previous high. Price will increase with large momentum showing the presence of many buy orders.
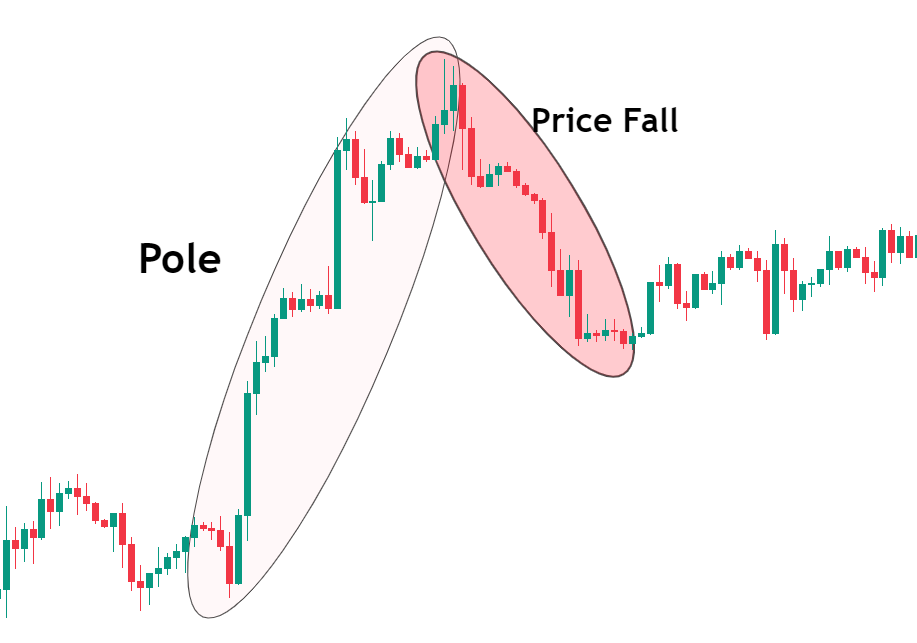
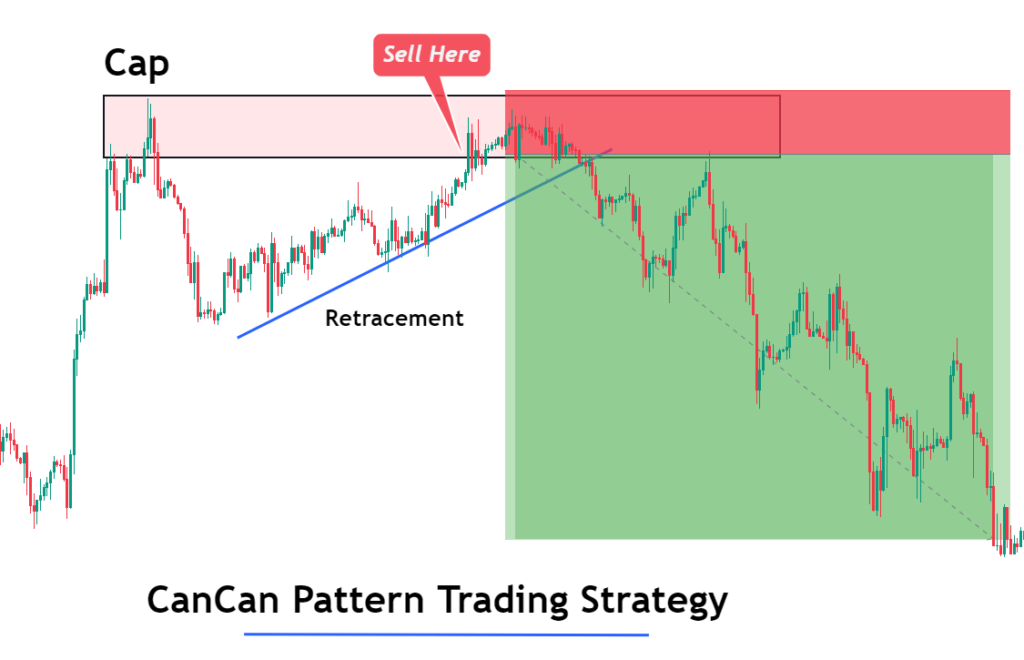
After the formation of the pole pattern, the price should retrace. But instead of retracement price will fall again within the pole, making a cap like structure. This price cap contains a lot of unfilled orders due to a large fakeout in the form of a breakout.
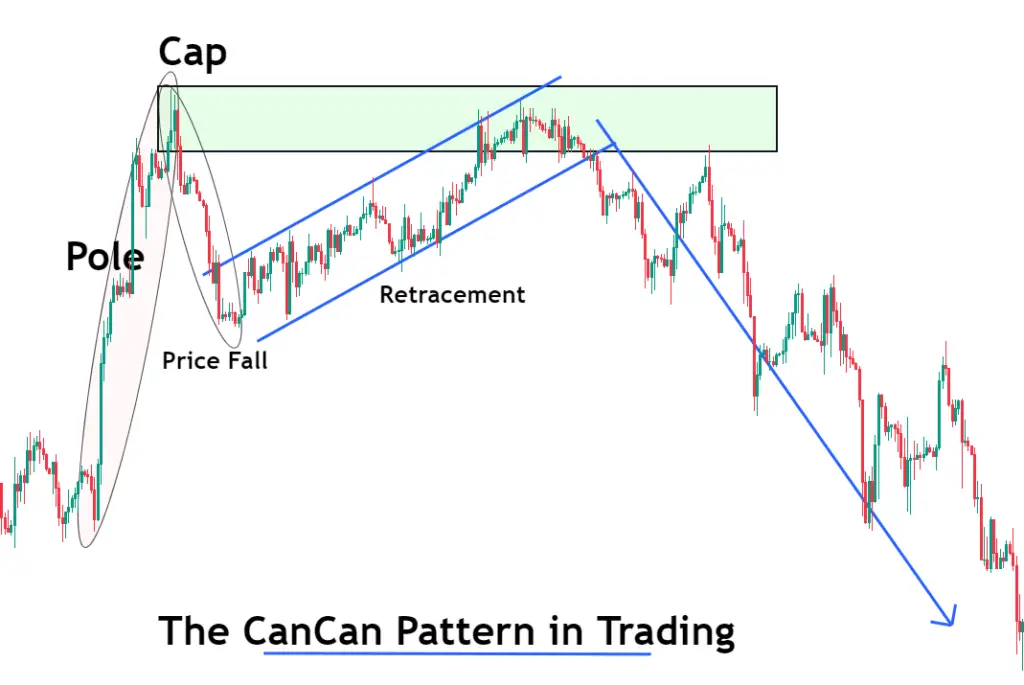
Now price will retrace from the bottom to the cap to fill those unfilled orders. It will form a compression like a pattern. After filling those unfilled orders, the price will fall with huge momentum, and a bearish trend will start.
In the first step, a pole will form, breaking the previous high. Price will increase with large momentum showing the presence of many buy orders.
Our focus as retail traders is to trade in the sell direction with the unfilled institutional orders.
The psychology behind the CanCan pattern
Before trading using a chart pattern, a retail trader must understand the psychology behind the chart pattern. Because if you don’t know about the origin and basics of a pattern, then you won’t be able to find the high probability chart patterns.
Let me explain to you the psychology behind the cancan pattern.
When a pole pattern forms on the chart, breaking the swing high, buyers are in full control and dominating the sellers in the market. After the breakout, the price will take a minor pause, and retail traders will buy, thinking of the resistance breakout with a buy signal.
After a minor pause, the price will come inside the pole, and retail traders will be out of the market.
Price will then start retracement in the bullish direction towards the cap. Retail traders will buy again during this retracement, thinking of trend continuation. Still, when the price reaches the level of a fakeout, unfilled institutional orders will trigger, and the price will move down with huge momentum.
So if you can find unfilled institutional orders, you can trade easily in the direction of big banks and institutions.
How to trade the cancan pattern?
After finding the cancan pattern, the next step is to the trading strategy. Learning a simple chart pattern will not make you a profitable trade until you add other technical confluences with proper risk management.
To increase the probability of winning in the cancan pattern, I will suggest adding the following two confluences
- FTR (fail to return)
- Flag limit
This strategy will look for the cancan pattern at the ftr zone or flag limit zone.
Here, the flag limit or FTR zone will act as a key level from where institutions or big banks make big decisions, while the cancan pattern is the market reaction at these key levels.
Open a sell trade
- Find a perfect cancan pattern on the chart and draw a zone on the cap of this chart pattern.
- Zoom out the chart and look for a valid flag limit zone or FTR zone.
- The cancan pattern should form at the flag limit or FTR zone.
- Place a sell limit order at the low of the zone that is drawn using the cap of the cancan pattern. And place a stop loss above the high of the flag limit or ftr zone.
- Take profit level is adjusted using the balance and imbalance zones on the chart. And risk only 2% per trade.
You can also place a stop loss above the cap. However, the protective stop-loss will always be above the flag limit or ftr zone.
The bottom line
The cancan is not a well-known pattern like other chart patterns, head & shoulders or triangle patterns etc. But the winning and risk-reward ratios of cancan patterns are much higher. If traded using FTR and flag limit concept, it becomes a complete trading strategy.
I will highly recommend you backtest this chart pattern at least 100 times.

