
Definition
Quasimodo pattern is a reversal chart pattern consisting of a left shoulder level and a break of the previous trend. It forms at the end of the previous trend. It is also known as the QM pattern.
Most traders don’t know about the Quasimodo chart pattern, but it is one of the advanced chart patterns. Traders use it to predict the trend reversal along with the pinpoint trade entry, which gives a high-risk reward ratio and less floating drawdown.
I will explain the Quasimodo pattern in detail in this article, so make sure to read the full article.
How to identify the Quasimodo pattern?
To find the QM pattern on the chart, follow the following guidelines:
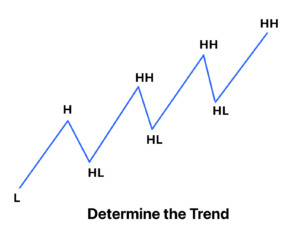
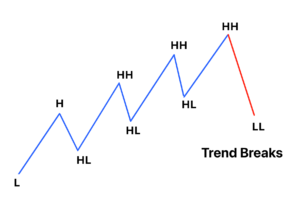
- First, determine the bullish or bearish trends (formation of higher highs or lower lows).
- Now look for a break of the previous trend (if the trend is bullish, a lower low will form after a series of higher lows).
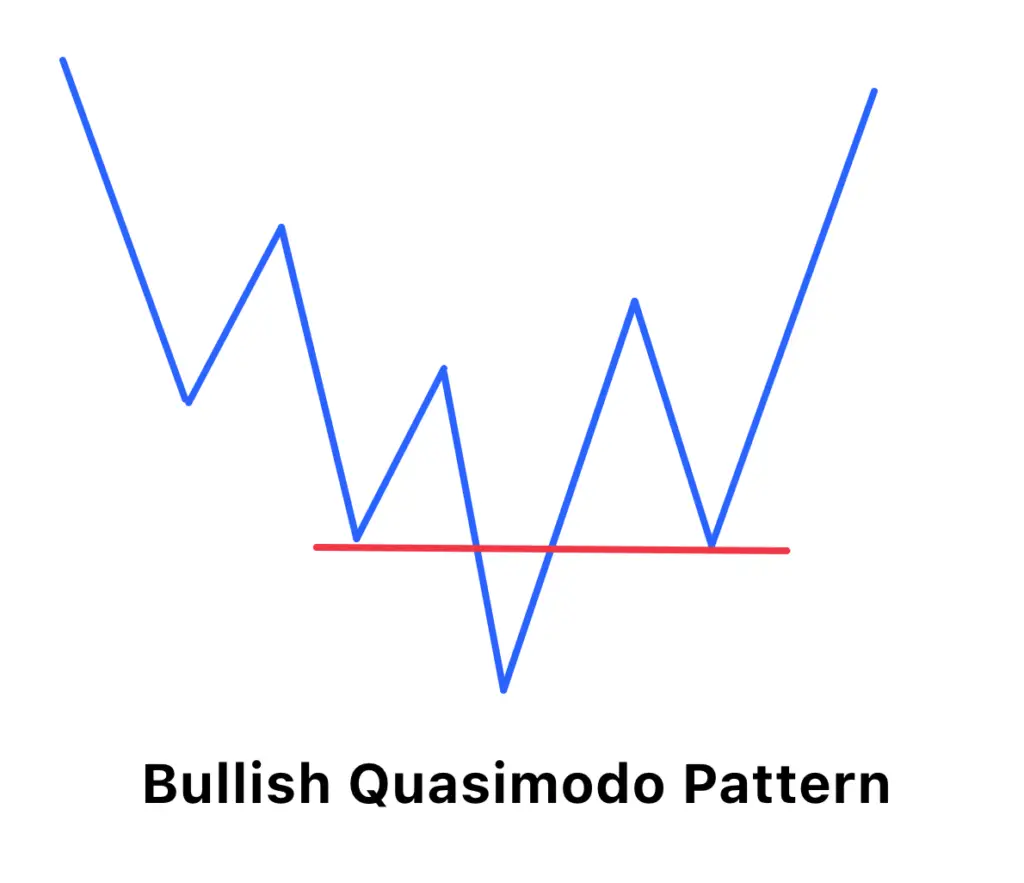
- After breaking of trend, draw a line on the high of the second last higher high and extend the line to the right. This level will act as left shoulder level.
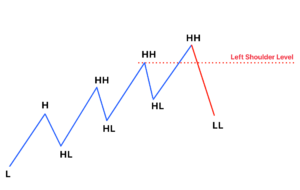
- Price will retrace to the left shoulder level, and a trend reversal will happen. A bullish trend will turn into a bearish trend.
These are the simple criteria to find the Quasimodo chart pattern on the candlestick chart.
Types of Quasimodo Pattern
The QM pattern is categorized into two types based on a trend reversal.
- Bullish quasimodo pattern
- Bearish quasimodo pattern
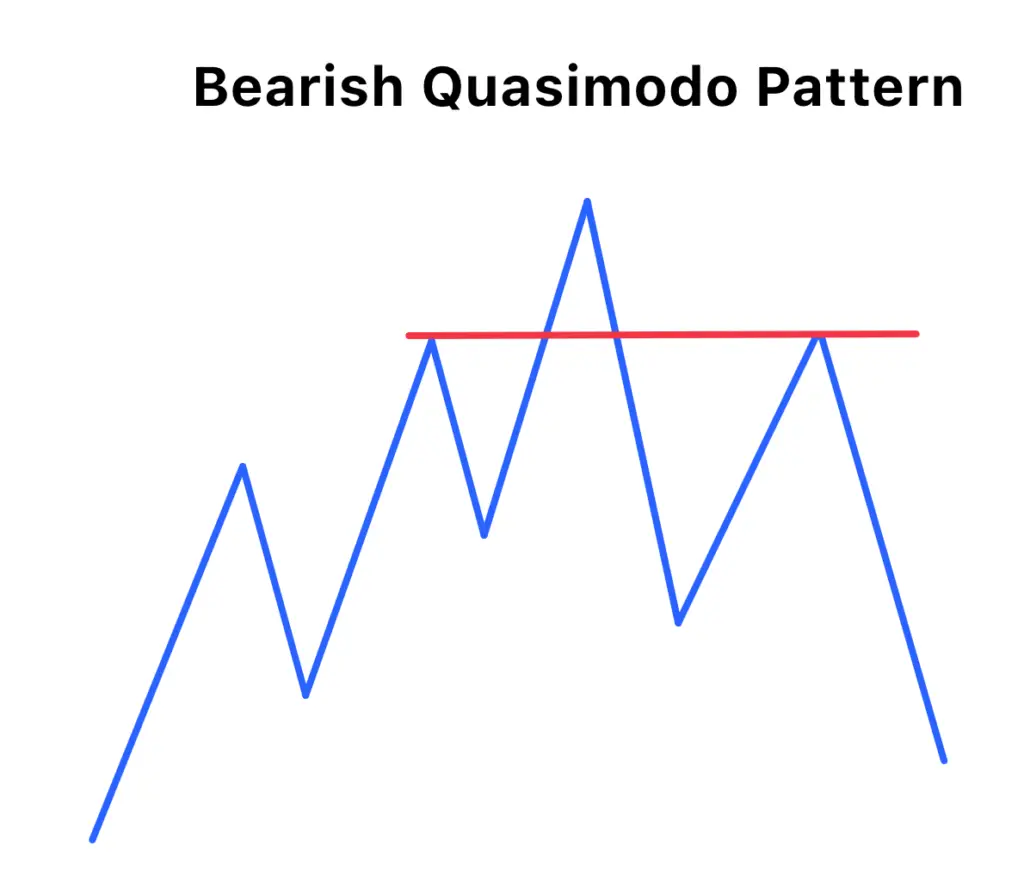
If the trend is bullish with a series of higher highs and higher lows, then a bearish quasimodo pattern will form with the formation of a lower low and left shoulder.
Conversely, if the trend is bearish with lower lows and lower highs, then a bullish Quasimodo will form with a higher high and left shoulder.
Working principle
The working principle of the qm pattern is straightforward. When a bullish quasimodo pattern forms after a series of bearish trends, then the bearish trend will convert into a bullish trend.
For example, in GBPJPY, the trend was bearish because lower lows and lower highs were forming on the chart. The simple way to determine the trend is by labeling the waves using lower lows and lower highs.
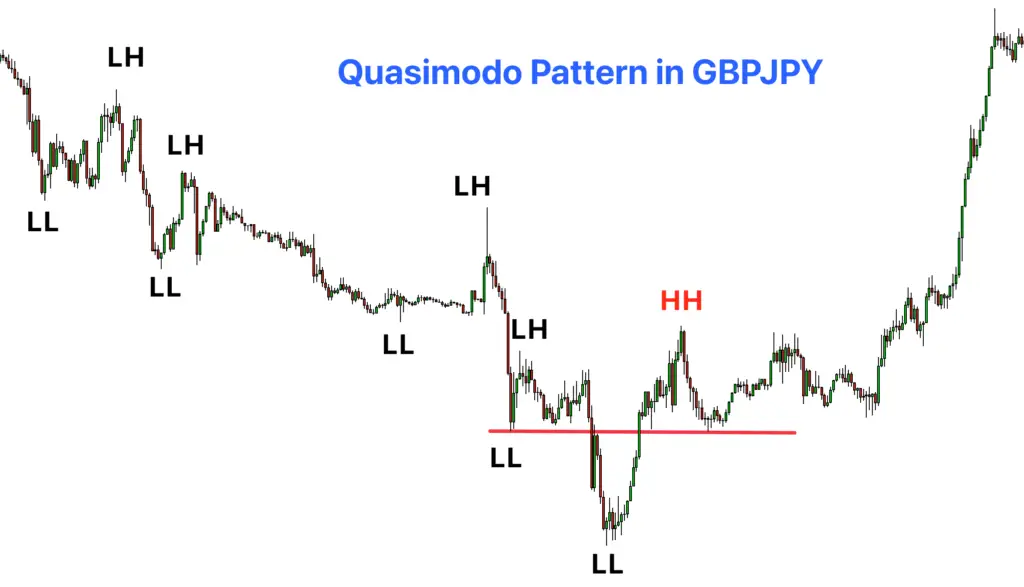
At the end of a trend, the price broke the previous lower high and made a new higher high. The formation of a higher high confirmed the reversal of a trend.
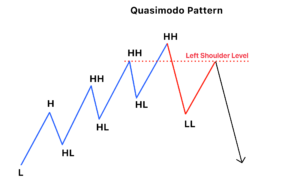
After this, the price retraced to the left shoulder level, forming a Quasimodo pattern.
Remember that the Quasimodo pattern only completes once the price retraces to the left shoulder level. The left shoulder level is the most important.
How to trade with the Quasimodo chart pattern?
In technical analysis, it is only possible to profit from a simple chart pattern. Every chart pattern predicts the market, but the chances of winning each time are less. That’s why a trader must try to combine one or two technical tools to increase the winning probability.
Here are two ways to trade with the qm pattern:
- Using trend line breakout
- Using the key levels or support resistance levels
QM pattern with support resistance zones
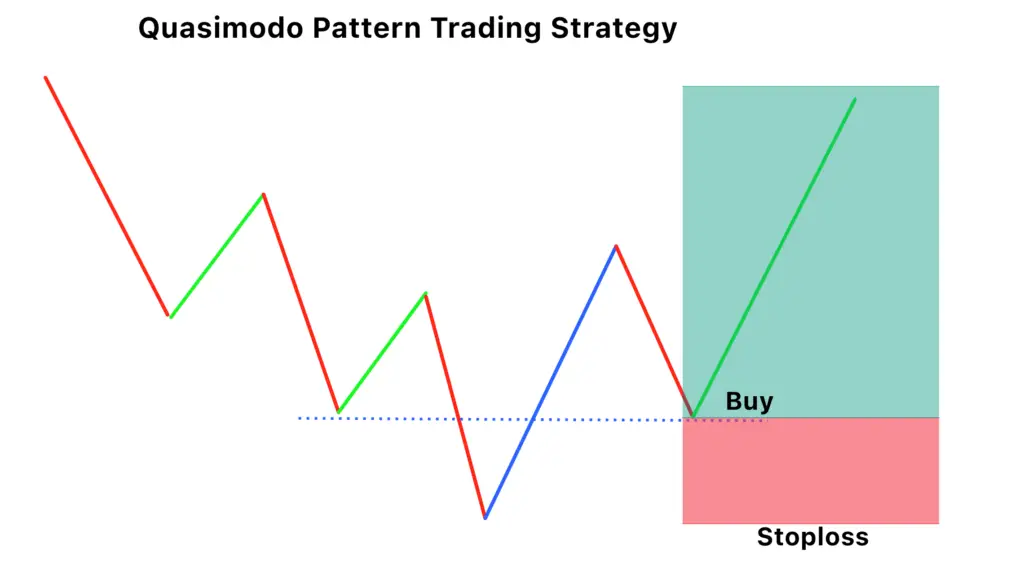
Combining the Quasimodo pattern with the support resistance zones is the most effective strategy.
Open a buy trade.
When a bullish quasimodo pattern forms after a series of the trend at the support zone, open a buy trade at the left shoulder level. And place stop loss below the lowest low or the support zone.
In fixing stop loss, I recommend choosing the safest option.
Close the trade at the higher high of the qm pattern.
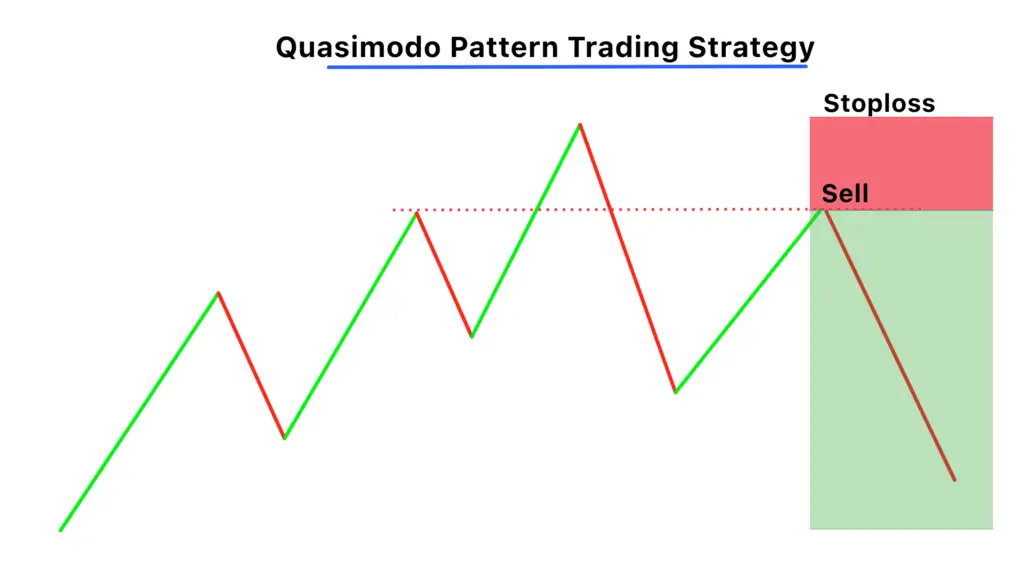
Open a sell trade
After a series of higher highs, find a bearish quasimodo pattern at the resistance zone, then opens a sell trade at the left shoulder level.
I suggest drawing a zone at the left shoulder level because you can miss profitable trade using the exact left shoulder price level.
Now place stops loss above the high of the qm pattern or above the resistance zone.
Close the sell trade at the lower low of the qm pattern.
Using trendline breakout
This is also a similar but effective trading strategy compared to the support resistance strategy.
In this strategy, both the Quasimodo pattern and trendline breakout should forecast in the same direction then the probability of winning will increase.
For example, After the trendline breakout in the bullish direction, the Quasimodo must form at the breakout, then the probability of a bullish trend will increase.
Kindly look at the image below for a better understanding of this strategy.

Key points to remember
- Series of bullish or bearish trends.
- Break the previous trend with the formation of higher highs or lower lows.
- Price retracement to the left shoulder level.
The bottom line
Trading is all about probabilities, and one of the best ways to identify trend reversal is by using the Quasimodo pattern. You can use this pattern in your strategy in many ways to get a higher winning ratio.
There are many other price action-related terms like FTR, Fail to return, and flag limit, which you should also read to learn price action in detail.

