Definition
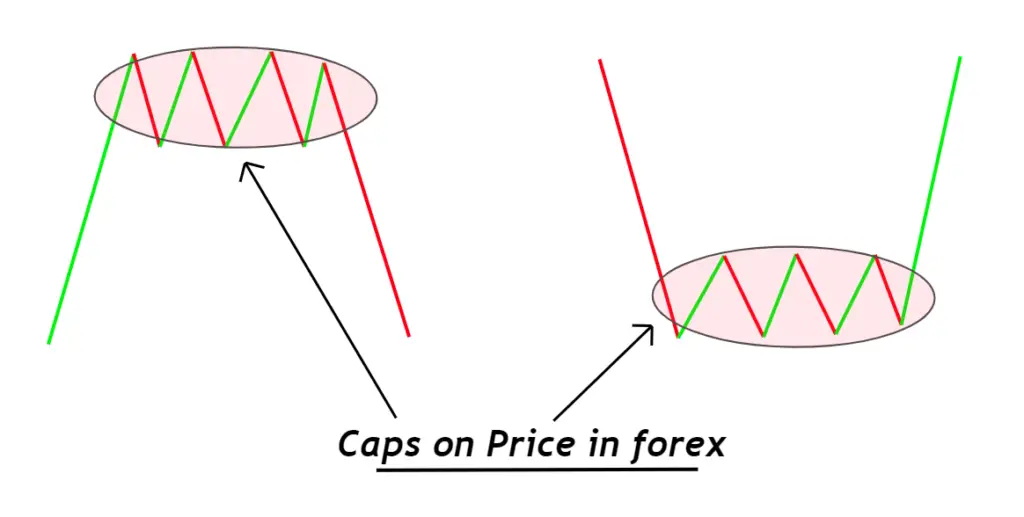
Caps on price in forex refer to the formation of rally base drop and drop base rally pattern on the candlestick chart.
The caps on price indicate a trend reversal in the forex market. There are many ways to determine these supply and demand trading patterns on the multi timeframes, which I will discuss in this article briefly. So, read the article thoroughly to understand this price pattern.
What are caps on price?
Price caps represent rally base drop and drop base rally patterns described on the chart.
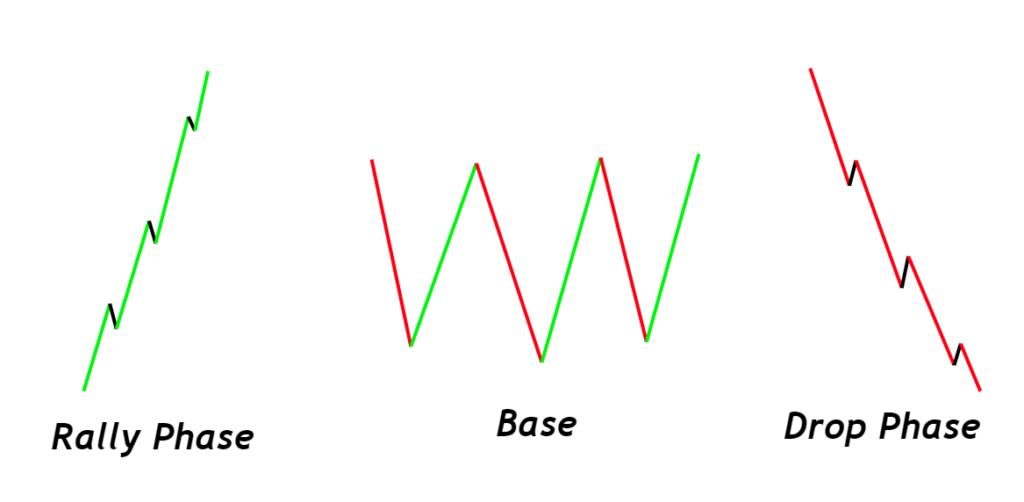
Rally base drop and drop base rally patterns consist of three phases in the market, and these phases are following:
- Rally phase: in this phase, bullish impulsive waveforms on the chart show the complete control of buyers in the market.
- Base phase: in this phase, the price moves sideways, representing indecision in the market.
- Drop phase: in this phase, bearish impulsive waveforms on the chart indicate complete control of sellers in the market.
RBD denotes rally base drop, and Drop base rally is denoted by DBR.
When an RBD/DBR pattern forms on the candlestick chart, the base region acts as a cap on the price. Let’s see the clear picture of this concept.
How do we identify Caps on price in forex?
There are two methods to determine price caps in trading. The first method is for beginners, and the second is for advanced traders. If you are a beginner trader, you should first practice the first method and then move on to the second method.
Method 1 to find caps on price
A big body bullish candlestick on higher timeframes indicates a complete impulsive wave in the lower timeframe. In contrast, a big body bearish candlestick shows a full bearish impulsive wave on the lower timeframe. And a higher timeframe Doji candlestick or candlestick with a small body and big wicks also indicates a ranging market structure on the lower timeframe.
Tip: Higher timeframe means 4H, daily, weekly, and monthly charts. While the lower timeframe means 1H, 30min, 15min, and 5min.
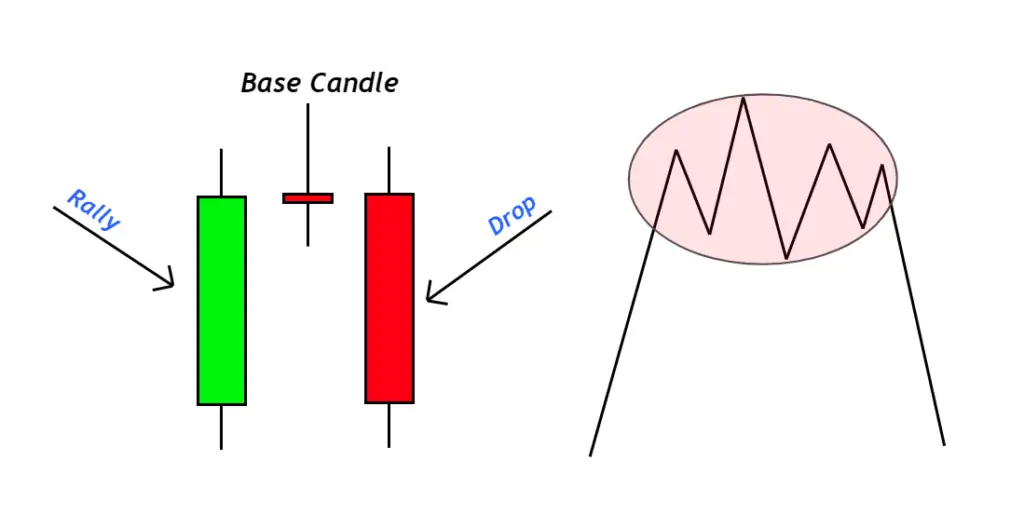
So, if you are a beginner, you will find it difficult to identify waves because of the complex market structure. That’s why I have made it easy for you. You need to look for three things on the chart:
- Big bullish candlestick (Rally)
- Big bearish candlestick (Drop)
- Doji candlestick (Base)
If you find this type of pattern on the higher timeframe, the price forms a cap on the lower timeframe, and you can easily trade it on lower timeframes to determine the trend reversals.
Look at the images below for a better understanding of this pattern.
Method 2 for advanced traders
This method is for advanced traders who can quickly identify the waves and market structure.
During the impulsive wave, price forms flags and poles. The flags are minor pauses in the price trend, and poles represent ultra-high impulsive price moves.
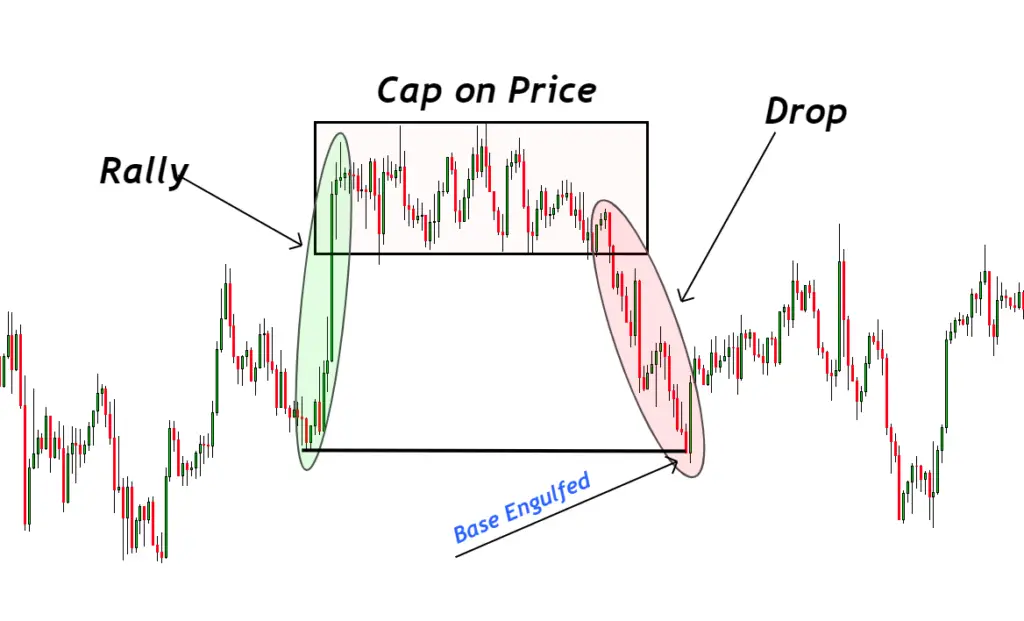
During the rally phase, the price will increase with a bullish impulsive move; then, it will move sideways. After then, it will move downward with a bearish impulsive move. This is the simple pattern to identify the cap on price in forex.
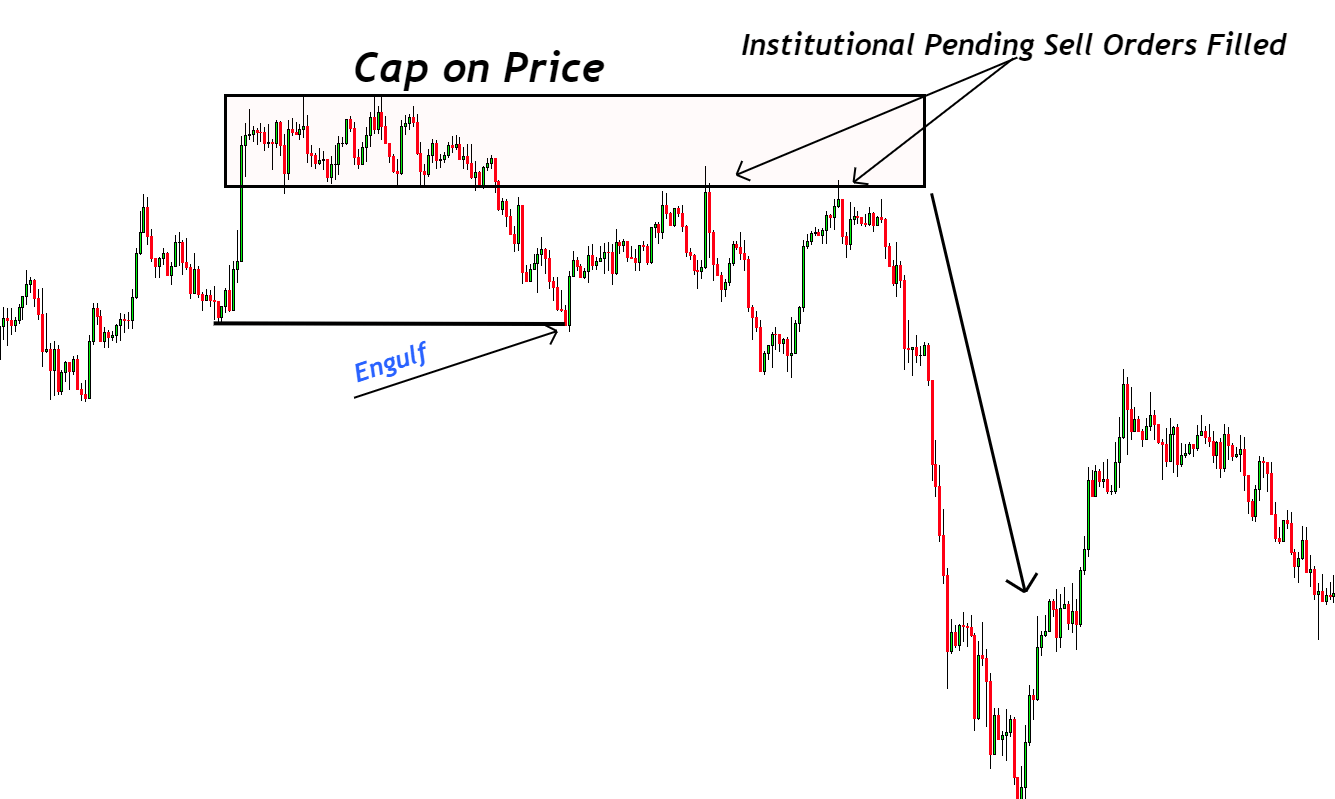
However, the important thing to be noted here is that price should engulf the base or starting point of the rally phase. I mean, the bearish drop wave should engulf the starting point of the bullish wave in the case of the RBD pattern.
While in the case of DBR, the rally wave should engulf the starting point of the drop wave. See the image below for a better understanding of this pattern.
How to trade the caps on price in forex?
These patterns are not traded directly, but they are traded with a trading strategy or confluence of other technical tools.
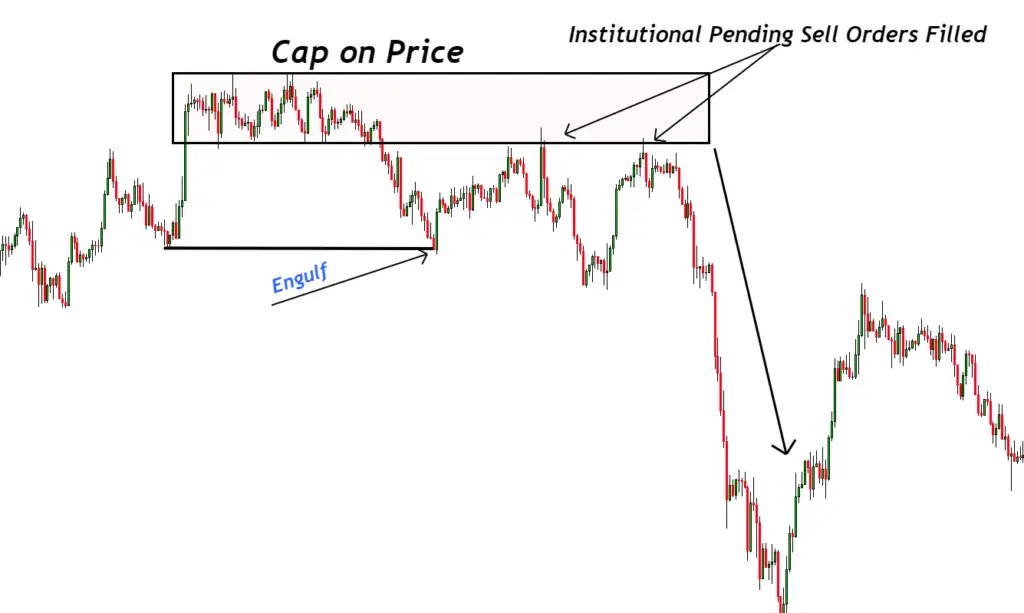
The central concept behind this pattern is that institutions put their pending orders at their base. For example, institutional traders place pending sell orders at the base region when a rally base drop pattern forms. After this pattern formation, the price comes back to the base region to fill the pending sell orders, and then a bearish trend starts. In short, a bearish trend reversal happens.
The Bottom line
The main reason you should learn it is that caps on price indicate major trend reversals. It helps capture more significant price moves to get higher risk-reward trade setups. You should also learn FTR and Flag limit patterns with the caps on price.
A high risk-reward ratio will improve the risk management strategy. I highly recommend you backtest this pattern at least 100 times to learn it. You will know many other points with screen time after the backtesting process.

