Definition
A flag limit is a price action term that means a zone that holds the price, and the price keeps on bouncing from this zone in technical analysis. It is denoted by “FL” in price action terms.
Rally base rally and drop base drop are two supply and demand terms representing the flag limits.
Most advance traders use the concept of flag limit in their analysis to forecast the price of a certain asset.

How to identify the flag limit in forex?
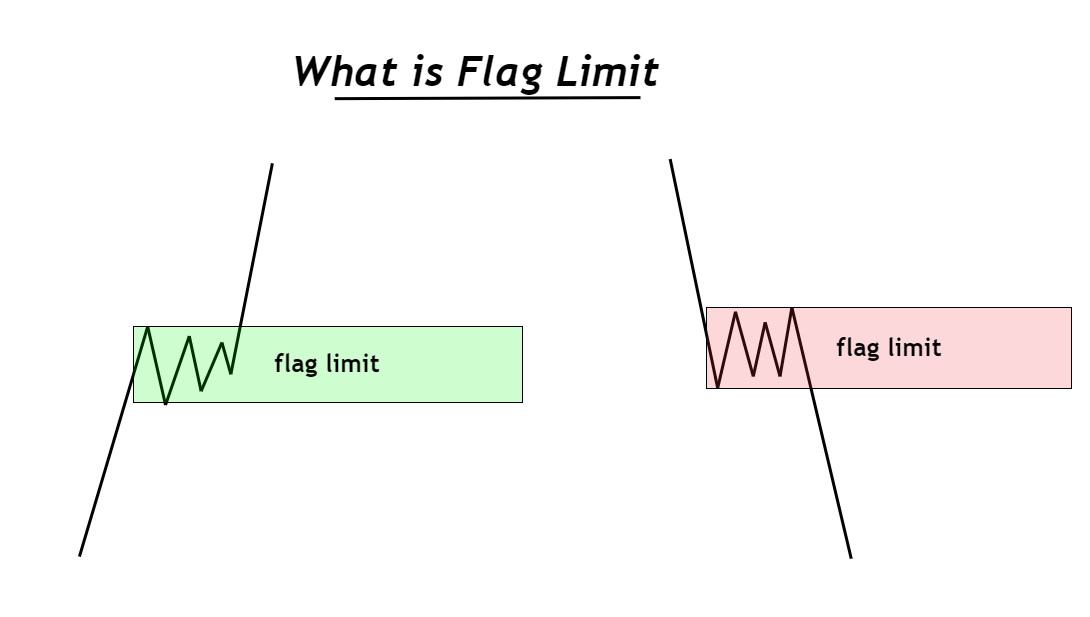
The flag limit is the advance price action pattern, and it is further categorized into bullish or bearish depending on the type of price action like rally base rally and drop base drop.
It originates from the word flag. And the flag always has a pole. The pole represents an impulsive wave, and the flag represents a sideways market structure.
The primary purpose of the flag limit is to hold the price.
- If the price is below the FL zone, then the flag limit will hold the price below that zone. Price will bounce from the zone until the FL breaks.
- In the same way, if the price is above the FL zone, then the FL will hold the price above that zone until it breaks.
Rally base rally and drop base drop in the price action gives rise to FL formation.
Type of Flag Limit in trading
And it is further categorized into two types.
- Upper flag limit
- Lower flag limit

Upper flag limit
The upper flag limit refers to the formation of the rally base rally pattern on the chart.
A rally means a bullish impulsive wave, and a base means a ranging price structure.
Look at the image below to understand better.
Lower flag limit
The lower FL refers to the formation of a drop base drop pattern on the chart.
Keep in mind that price moves sideways during the base formation, like indecision in the market.
How does the flag limit work on the chart?
After the flag limit identification process, you should understand the working of the FL to trade it in a better way.
There are a lot of flag limits form on the chart, but all the flag limits are not important. A trader should always refine the odds only to increase the probability of winning trade setups.
The first method is identifying a flag limit at a key level or SR flip level.
In this method, you will have to find key levels or SR flip levels on the chart. Key levels are the price levels that are under traders’ attention, and price always bounces above or below those levels. These levels are major trend reversal price levels on the candlestick chart.
As we know, FL zones already act as price reversal zones. So if we combine the effect of both key levels and FL zones, then the probability of price trend reversal will increase a lot of times.
The point to be noted here is that you should identify only those flag limits that form at certain key levels.
Key levels can have many types. Let me list three main points here
- SR flip levels
- Strong reversal levels due to news or major event
- Last price swing levels
What does the flag limit tell traders?
The flag limit is a decision area on the chart. Buyers and sellers decide their next moves in this region. That’s why the price moves sideways during FL formation. Traders decide at this zone either to continue the previous trend or take a price trend reversal.
So, when an FL forms, it becomes an important area for traders because prices always move from one zone to another.
In the future, when the price retraces back to the FL zone for the first time, it is called FTB or the first time back. During this time, price again decides its direction in this zone. There are many chances that the flag limit will hold the price.
There is no 100% guarantee that the FL will always hold. We use other strategies like a reversal chart pattern at the FL zone to increase the chances of a trend reversal.
So, the confluence is necessary for every trade setup.
Example #1
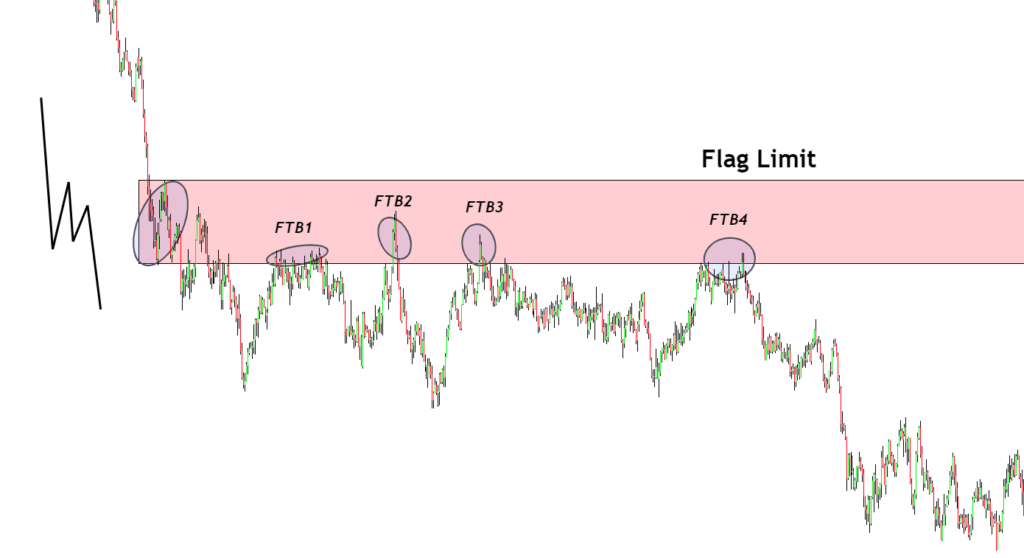
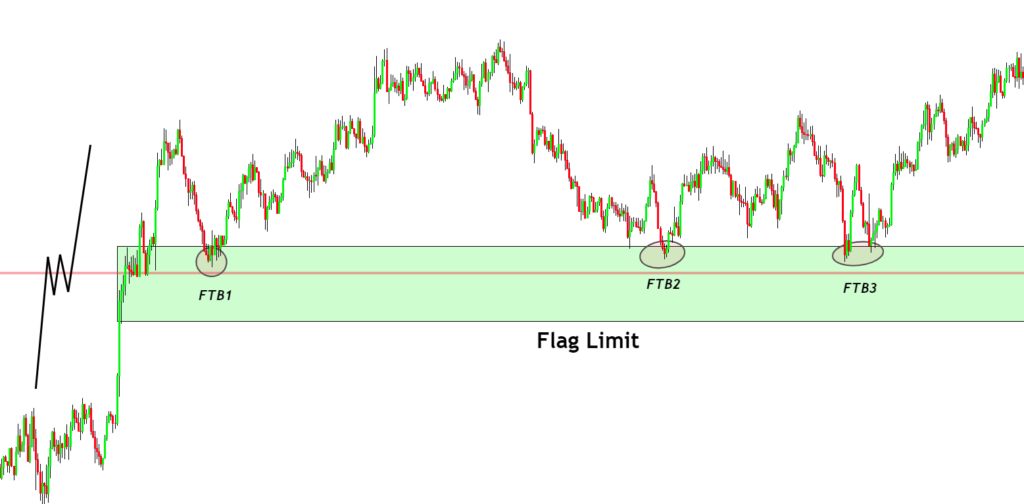
In this example, look at the price action on the chart and check how the price respects the FL zone. The zone drawn on the FL base holds the price in the bearish direction. It has four FTB areas, which means it is a strong FL zone and is now about to break soon.
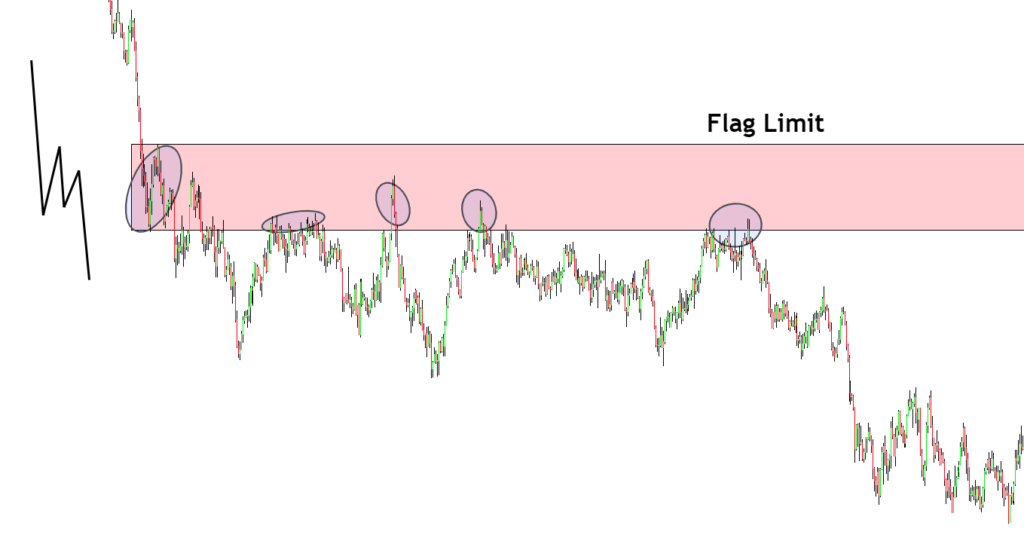
FTB means first time back. When the price returns to the FL zone, it is called the first time back.
The best method to trade the FL zone is on FTB2 and FTB3. This is a powerful price action trading method.
Tip: The simplest method to identify a good flag limit is to detect the impulsive wave, then a ranging market phase, and then an impulsive wave.
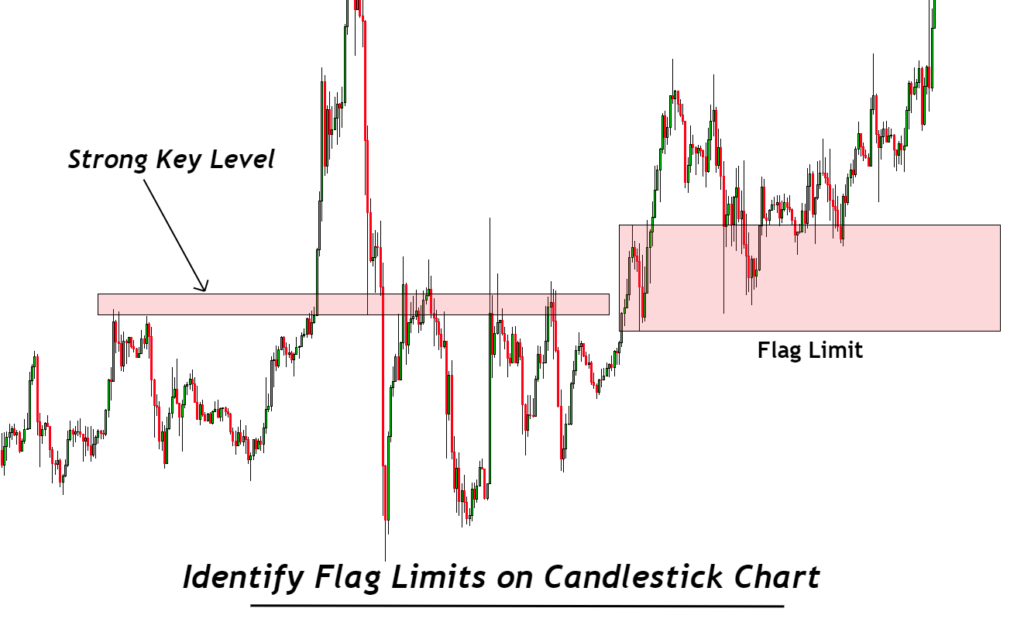
Example #2
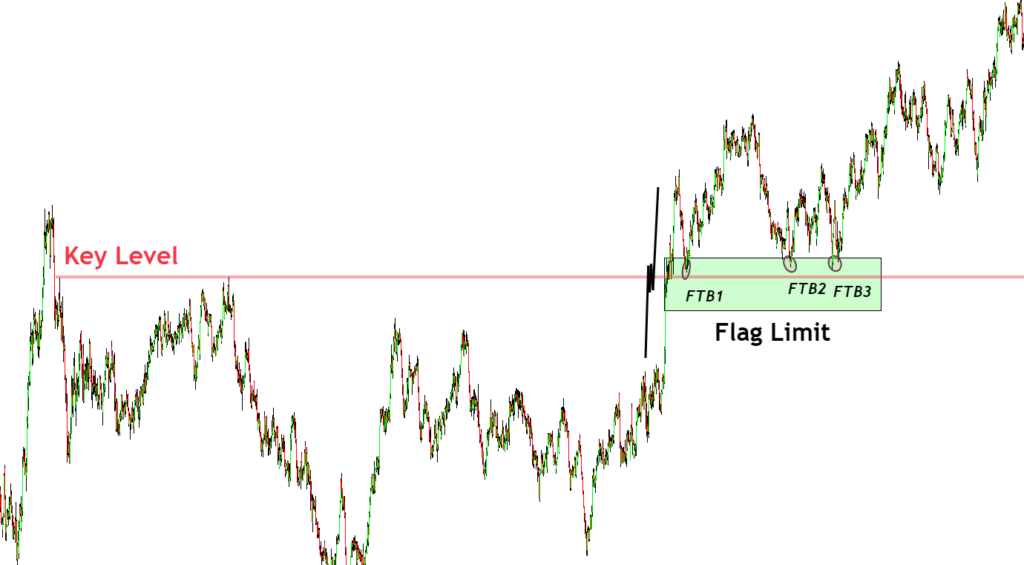
This is an example of an upper flag limit at the key level. As discussed above, the probability of trend reversal from the FL increases when it forms at a key level.
Like in the image, the key level was a strong resistance level. Price broke that resistance level formed a range at this zone, and continued its bullish trend. The formation of the range made an FL zone. Then, the price gave three FTBs, and the FL successfully held that price level.
The Bottom line
After identifying a trend reversal pattern, you should always look in the past to find an FL zone because a flag limit zone will help determine a fixed range that can be used for a safe stop loss level.
To draw a valid FL zone, you should check the chart’s key levels and important price levels.
The flag limit is an advanced price action concept after support and resistance in trading. To understand it completely, backtest this pattern at least 100 times. With time you will learn to find and trade good FL zones, and this pattern will improve your trading to much extent.


AWESOME SHARES..thanks. Looking forward to more content.
Thanks bro,for the insights,very helpful
Very insightfull will backtest to perfect
Thank you for sharing this much simplified.