Definition:
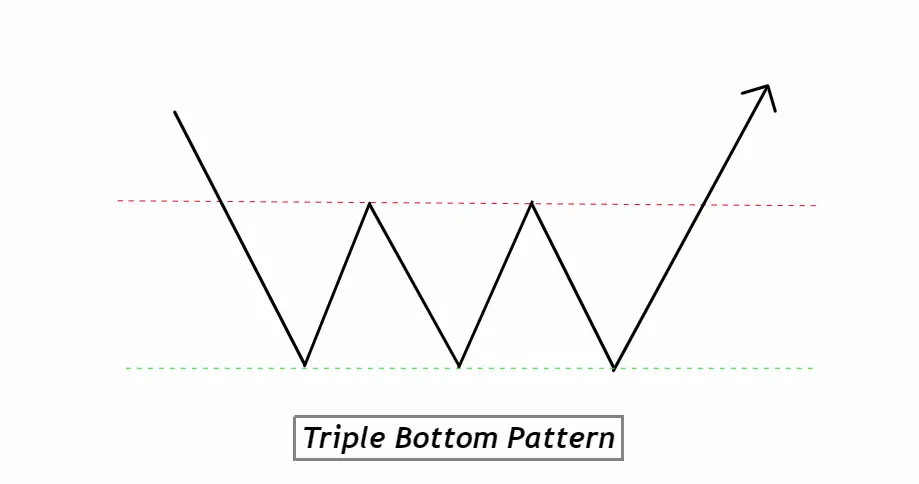
Triple Bottom Pattern is a bullish reversal chart pattern characterized by three distinct troughs at roughly the same price level, following a prolonged downtrend. The Triple Bottom Pattern signals a potential reversal from bearish to bullish sentiment, typically indicating a strong support level from which the asset’s price may rally.
How to Identify the Triple Bottom Pattern on a Chart:
- Prior Downtrend: Before the formation of the triple bottom, there should be a noticeable downtrend in the asset’s price. This sets the context for the reversal pattern.
- Three Troughs: Look for three distinct price troughs or lows. These troughs should all be at roughly the same price level, with minor variations.
- Volume Consideration: Volume usually diminishes during the formation of the troughs and increases during the price upswing between them. A surge in volume during the breakout (price moving above resistance) adds to the pattern’s reliability.
- Separation Between Troughs: Each trough should be separated by a period of time with a moderate price rise in between. This price rise often stops at a similar resistance level, forming the top of the pattern.
- Breakout: The confirmation of the pattern is a breakout above the resistance level that has formed at the peaks between the troughs. The breakout signifies a potential reversal of the prior downtrend.
- Duration: The pattern can form over several weeks to several months. Longer formations generally provide more significant reversals.
Significance and Indications of the Triple Bottom Pattern:
1. Strong Reversal Signal: The Triple Bottom Pattern is revered by traders because it serves as a strong indication of a change in market sentiment. After an extended downtrend, the occurrence of three consecutive troughs at roughly the same price level showcases that there’s a strong level of support. This support level is where buyers consistently enter the market or where selling pressure starts to wane. The very fact that the price tests this level three times and fails to break through signals a weakening bearish momentum.
2. Predictive Power: When the Triple Bottom is confirmed—typically with a breakout above the resistance level—it can provide traders with a target price, offering a measurable technique for potential profit. By measuring the distance from the resistance level (formed at the peaks between troughs) to the bottom of the pattern, and then projecting that same distance upwards post-breakout, traders can set price targets and adjust their trading strategy accordingly.
3. Risk Management: For traders, one of the major advantages of recognizable patterns like the Triple Bottom is the ability to set clear stop-loss points. If a trader acts on a Triple Bottom pattern and the price unexpectedly falls below the established support level, it’s a clear signal that the pattern has failed, allowing the trader to minimize potential losses.
4. Enhanced with Volume Analysis: The Triple Bottom Pattern’s reliability increases when combined with volume analysis. Typically, volume diminishes as the pattern forms, but a surge in volume during the breakout adds conviction to the bullish reversal. Hence, traders who pay attention to volume dynamics in conjunction with the pattern can make more informed decisions.
In summary, the Triple Bottom Pattern is a valuable tool in a trader’s arsenal, offering insights into potential trend reversals, clear risk management parameters, and the added benefit of price forecasting. Like all chart patterns, it’s most effective when used in conjunction with other indicators and analysis techniques.
Activity of Big Traders During the Formation of the Triple Bottom Pattern:
1. Accumulation Phase: One of the primary behind-the-scenes activities during the formation of the Triple Bottom Pattern is the accumulation by institutional or “big” traders. When prices reach the support level during the first trough, these large traders, seeing the value or potential upside, may start accumulating or buying the asset. This buying interest prevents the price from dropping further, creating the support level.
2. Testing the Waters: Each subsequent trough in the Triple Bottom pattern can be seen as a test by these large traders. They’re essentially probing the market to see if the support level holds. The consistency of the support level indicates a strong consensus about the asset’s value, making it a safer entry point for these big players.
3. Diminishing Selling Pressure: The inability of the price to make a new low during the formation of the Triple Bottom Pattern suggests that selling pressure (possibly from earlier institutional distribution) is waning. The big traders are either holding off from selling, or they’re the ones becoming net buyers, absorbing the supply and establishing a floor.
4. The Breakout Catalyst: Often, the breakout above the resistance level (after the third trough) is propelled by significant buying from institutional traders. They recognize the pattern’s bullish implication and want to capitalize on the impending uptrend. This is usually where a noticeable surge in volume occurs, signaling strong buying interest and adding conviction to the pattern’s reversal signal.
5. Psychology at Play: The formation of a Triple Bottom is also a game of psychology. As the pattern repeats and the price fails to break the support, more traders (both big and retail) recognize the pattern. The combined belief in the pattern’s bullish implication can itself act as a self-fulfilling prophecy, driving prices up after the third trough.
For retail traders, understanding the activities and strategies of institutional players during the formation of patterns like the Triple Bottom is crucial. By recognizing these signs, they can better align their strategies with the market’s bigger forces, increasing the odds of trading success. Always remember, while these patterns offer insight into potential market movements, they should be used in conjunction with other tools and indicators for a comprehensive trading approach.
Confirmation Table for High Probability Triple Bottom Pattern Recognition
| Tool/Indicator | Description | Confirmation Significance |
|---|---|---|
| Key Level (Support) | The price level at which the asset consistently finds support during the formation of the three troughs. | A robust key level indicates strong buying interest at a particular price, bolstering the reliability of the pattern. |
| Break of Resistance | Post-formation, the asset price should break above the established resistance level (formed between the troughs) to confirm the pattern. | A break above resistance, especially on high volume, signals a potential bullish reversal and validates the pattern. |
| Volume Analysis | Track the volume during the pattern’s formation and especially during the breakout. | Diminishing volume during the formation and a surge during the breakout increases the pattern’s credibility. |
| Momentum Indicators (e.g., MACD, RSI) | These tools measure the speed and strength of price movements. | Momentum shifting from bearish to bullish as the pattern forms and confirms can add another layer of verification. |
Traders should note that while using multiple tools and indicators increases the likelihood of accurately identifying the Triple Bottom Pattern, there’s no foolproof method. Each trade carries inherent risk, and these tools should be utilized to make informed decisions, not to guarantee outcomes.
Optimal Conditions for Trading the Triple Bottom Pattern
Best Timeframe: For the most reliable signals, the Daily timeframe is recommended. While the Triple Bottom can appear on shorter timeframes like 1H or 4H, the implications on the Daily chart tend to be more significant and less prone to false breakouts.
Trading Session: Trading during the main sessions of the asset in question is optimal. For Forex, this means the London and New York sessions, as they offer the highest liquidity and volume. For stocks, trade during the respective market’s main operating hours.
Winning Ratio: While the Triple Bottom is a strong pattern, it’s not infallible. When traded correctly and with proper confirmations, a winning ratio of approximately 60-70% can be expected. However, this number can vary based on other market conditions and the trader’s skill set.
It’s crucial for traders to remember that these conditions and numbers are guidelines and can vary based on the broader market environment and individual trading strategies. Always employ risk management and never rely solely on a single pattern or indicator.
Triple Bottom Trading Strategy with Confluence
1. Entry Point: Look for a strong breakout above the resistance level that has formed between the troughs of the Triple Bottom Pattern. To add confluence, ensure that this breakout is supported by:
- A surge in volume.
- Bullish momentum indicators (e.g., MACD crossing above its signal line or RSI moving above 50).
2. Stop Loss: Place the stop loss just below the most recent trough of the Triple Bottom or, for added security, below the lowest point of all three troughs. This ensures you’re protected if the pattern fails and the price drops below support.
3. Take Profit Level: Calculate the depth of the pattern (distance between the resistance level and the bottom of the pattern) and project that upwards from the breakout point. This provides a potential target. However, traders might also look for key resistance levels or round numbers as additional profit-taking points.
Conclusion on the Triple Bottom Pattern:
The Triple Bottom Pattern is a powerful tool indicating a potential bullish reversal in the market. When combined with other indicators for confluence, it offers a high-probability trading strategy. Nevertheless, traders should always employ proper risk management and understand that while the pattern can provide guidelines, market conditions can change, and no single strategy guarantees success.

