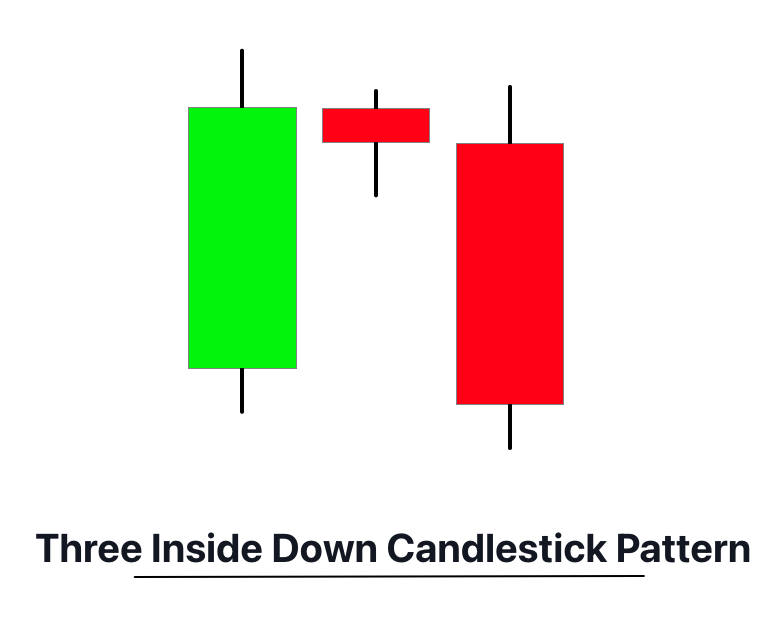
The Three Inside Down is a bearish reversal candlestick pattern consisting of three candles: an initial bullish candle, followed by a smaller bearish candle fully enclosed within the first candle’s range, and a final bearish candle closing below the second candle’s close.
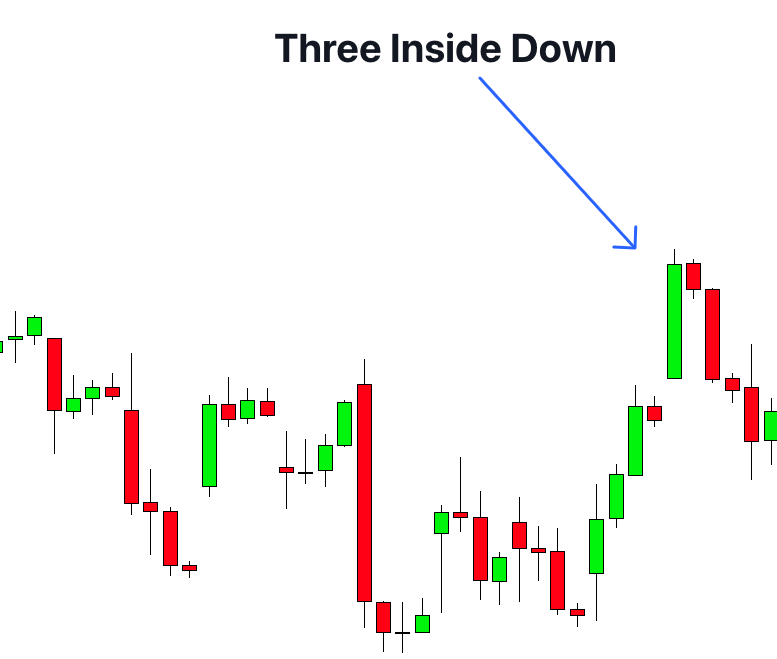
Often spotted at the end of bullish trends, the Three Inside Down pattern is a powerful signal that demonstrates a shift in the market sentiment, indicating that sellers have taken control and a potential downtrend could be underway.
How to identify the Three Inside Down Candlestick Pattern?
Identifying the Three Inside Down candlestick pattern on a chart involves the following steps:
- Bullish Start: Look for an existing upward trend. This pattern is a bearish reversal pattern, so it typically appears after a period of bullish market sentiment.
- First Candle: The first candle should be a long bullish (green) candle, indicating a continuation of the prior upward trend.
- Second Candle: The second candle should be a small bearish (red) candle that is fully enclosed within the range of the first candle. This means the high of the second candle is lower than the high of the first, and the low of the second candle is higher than the low of the first.
- Third Candle: The third candle is a bearish (red) candle that closes below the close of the second candle. This is a key indication of a bearish reversal.
- Confirmation: Finally, for a pattern to be confirmed as a Three Inside Down, the third candle should close below the second candle’s close, signaling a reversal of the prior bullish trend.
By recognizing these criteria, traders can accurately identify the Three Inside Down pattern on a chart.
Significance
The Three Inside Down candlestick pattern holds significant importance as a bearish reversal signal in technical analysis. Appearing after an uptrend, it serves as an indication that selling pressure is overcoming buying pressure, hinting at a potential trend reversal from bullish to bearish.
The pattern starts with a strong bullish candle, followed by a smaller bearish candle entirely within the range of the preceding one, suggesting that the buyers are losing their grip. The final bearish candle closing below the second candle’s close confirms the shift in momentum, demonstrating that sellers have now taken control. This transition can suggest a good opportunity for traders to potentially open short positions or exit long positions, expecting a decrease in price.
Activity of traders behind the chart
When the Three Inside Down candlestick pattern forms, it’s often an indication that larger, institutional traders are beginning to liquidate their long positions or initiate short positions, contributing to the shift in market sentiment from bullish to bearish.
The first candle represents the final push of the buyers, often led by retail traders, while the institutional investors start to sell their holdings. The second candle, which is a smaller bearish one, represents the increasing influence of the sellers, including institutional traders who are capitalizing on the higher prices to offload their positions.
The third candle, which closes lower than the second one, is typically the result of the full entry of these big traders into the sell side, pushing prices lower with significant volume. These market participants have substantial influence due to their large trading volumes, and their activities often signal major trend reversals.
Confluences
Here are four tools that can help confirm the validity and high probability of the Three Inside Down pattern:
- Key Levels: Check if the pattern forms near important levels of resistance. The first candle’s high should touch or be near this resistance level for an increased likelihood of the pattern playing out.
- Break of Low: A break below the low of the first candle in the pattern after the formation of the third candle provides confirmation of the pattern. It indicates the bears’ control over the market.
- Volume: High trading volume on the second and third candle, especially the third candle, adds credibility to the pattern. It signifies increased selling pressure and participation in the downward move.
- Technical Indicators: Indicators such as RSI or MACD showing overbought conditions or bearish divergence respectively can add an extra layer of confirmation to the validity of the pattern.
Key Points
- Best Timeframe: The Three Inside Down pattern can be spotted across various timeframes. However, it is often more reliable on higher timeframes such as the 1-hour, 4-hour, or daily chart. This is because higher timeframes filter out the ‘noise’ of price fluctuations seen on shorter timeframes.
- Trading Session: This pattern can be traded during any session, including the New York, London, and Asian sessions. But for major currency pairs, the pattern may have more significance during the London and New York sessions when trading volume is at its highest.
- Winning Ratio: The exact winning ratio can vary significantly depending on various factors such as market conditions and the trader’s skill level. However, with proper risk management and confirmation tools, traders can potentially achieve a winning ratio around 60-65% with this pattern.
Trading Strategy
- Entry Point: The first step is to identify the Three Inside Down pattern formation on the chart, with the pattern being formed at a key resistance level for better reliability. The ideal entry point would be to sell at the opening price of the next candle after the pattern.
- Stop Loss: A suitable place for the stop loss would be a few pips above the high of the first candle in the pattern. This accounts for any price spikes that might occur and prevents premature stop-out of the trade.
- Take Profit: As for the take profit, a conservative approach would be to set it at an equal distance from the entry to the stop loss. Alternatively, you could aim for the next significant support level.
Conclusion
The Three Inside Down is a bearish reversal candlestick pattern signaling potential downtrend continuation. It’s easy to spot and could be a beneficial tool for traders when used alongside other technical analysis tools and indicators. The pattern, however, like all trading strategies, isn’t foolproof and should be used with proper risk management.

