Definition
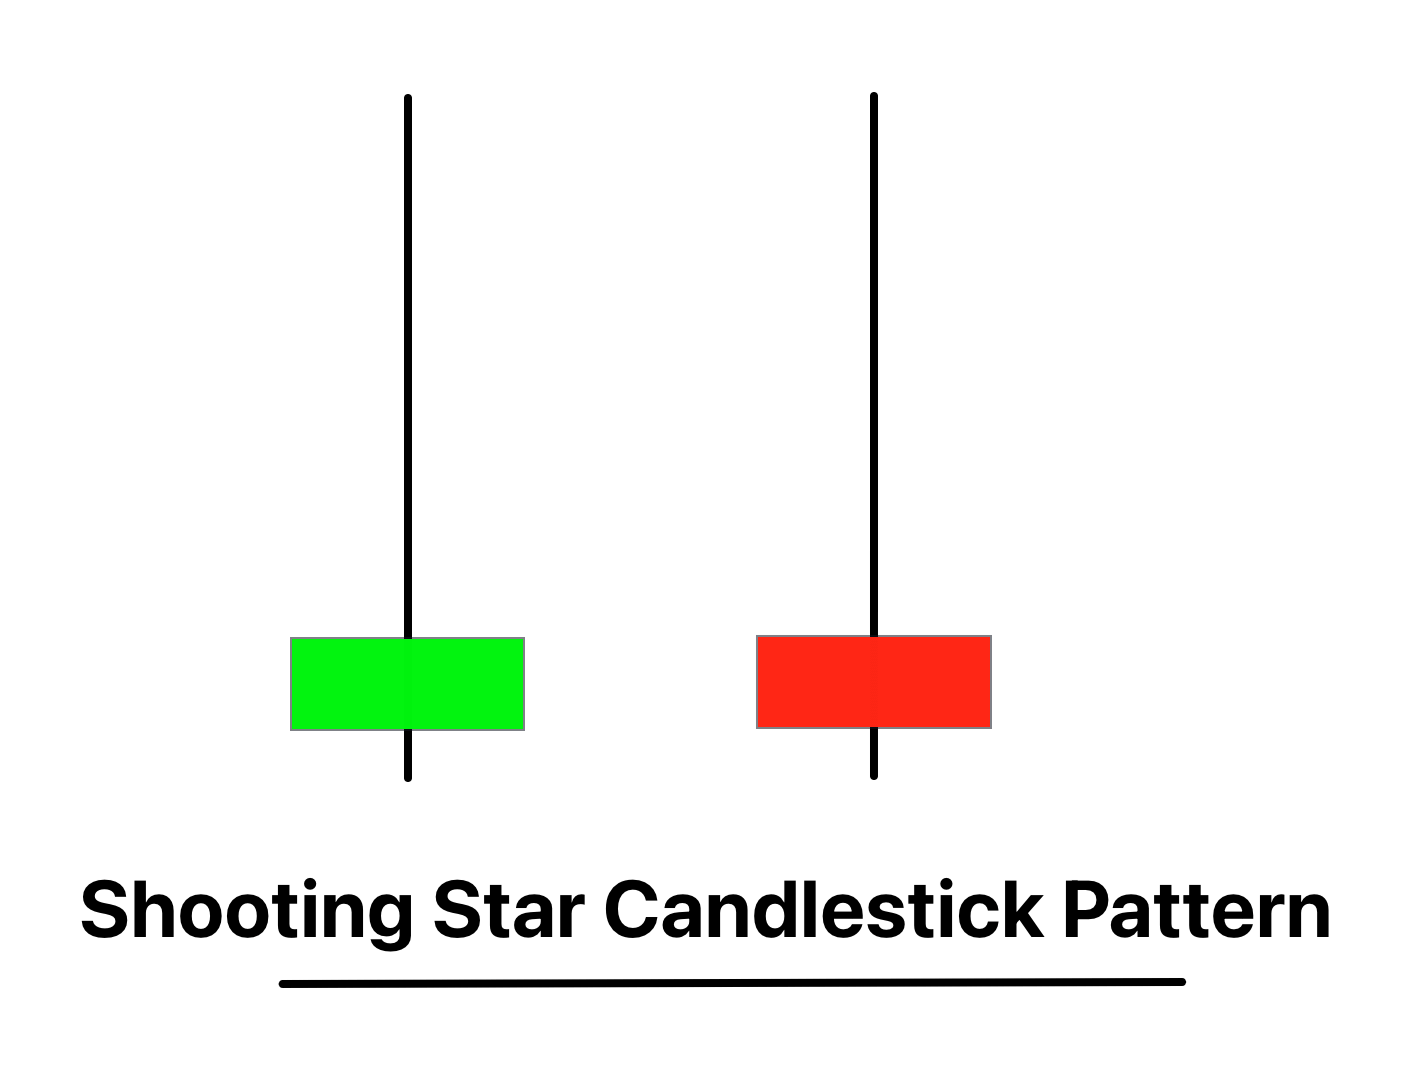
The Shooting Star candlestick pattern is a bearish reversal pattern characterized by a small real body at the lower end and a long upper shadow, signifying a potential trend reversal from bullish to bearish.
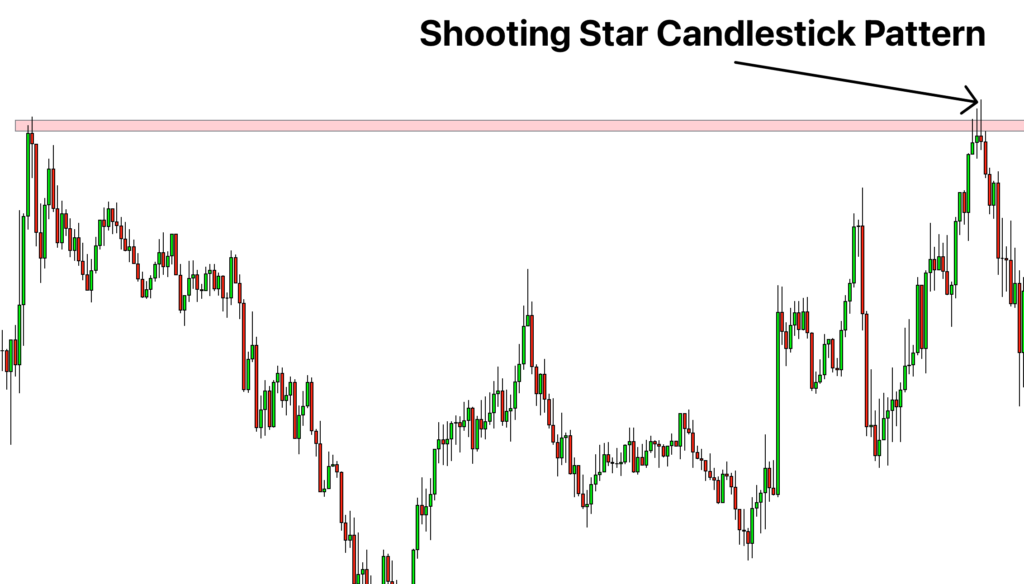
The Shooting Star is a crucial pattern in technical analysis, often appearing at the end of an uptrend. Traders closely watch this pattern as it suggests that the bulls may be losing control and a bearish reversal could be on the horizon.
How to identify the shooting star candlestick pattern?
Identifying the Shooting Star candlestick pattern involves looking for specific characteristics in the price chart. Here’s how to spot this pattern:
- Prior Uptrend: The Shooting Star appears after a noticeable uptrend in price. This context is vital as the pattern signals a potential bearish reversal.
- Small Real Body: The real body (the part of the candlestick between the open and close price) of the Shooting Star should be small. It represents the trading range between the open and close prices for the period and can be either bullish (white/green) or bearish (black/red).
- Long Upper Shadow: The upper shadow (the line above the real body representing the high and low prices for the period) should be significantly long, typically at least twice the length of the real body. This long shadow indicates that during the trading period, prices were pushed up significantly but were rejected and fell back down to close near the open.
- Little or No Lower Shadow: The Shooting Star usually has little to no lower shadow (the line below the real body). This suggests that sellers controlled the price action during the latter part of the period.
Significance
The Shooting Star candlestick pattern is a significant technical indicator that traders often use to predict a potential price reversal from bullish to bearish.
Here’s what this pattern signifies and indicates:
- Bearish Reversal: The Shooting Star signals a possible bearish reversal in the market. It forms during an uptrend when bulls start to lose their grip, and bears begin to take control.
- Market Indecision: The long upper shadow represents a period of trading during which the prices were driven up, indicating strong buying interest. However, the fact that the market couldn’t sustain these high prices and closed near the opening price shows a reversal of sentiment, suggesting that the buyers could not maintain their control.
- Seller Dominance: The appearance of a Shooting Star, particularly one followed by a gap down or a long bearish candle, indicates an increased selling pressure. This is a sign of sellers overpowering the buyers, potentially leading to a downward price movement.
Activity of traders during formation of shooting star candlestick
The formation of the Shooting Star candlestick pattern can provide valuable insights into the activities of large, or institutional, traders in the market. These large traders have the power to move the markets, and their actions can often serve as a guide for retail traders.
- Attempted Rally: The long upper shadow of the Shooting Star indicates that during the trading period, large buyers tried to push the price upwards. This could be interpreted as an attempt by institutional traders to test the market’s resilience or possibly even trigger stop orders above the current price range.
- Price Rejection: However, the fact that the market failed to sustain these high prices, closing near the opening price, suggests a strong rejection. This could indicate that large traders are beginning to sell their positions, hence driving the prices down.
- Increased Selling Pressure: If the next candle closes below the Shooting Star’s body, this indicates increased selling pressure, potentially from big traders closing their long positions or opening short positions. This could be the cue for retail traders to consider bearish trades.
- Volume Analysis: The volume during the formation of the Shooting Star can also provide insights. A high volume during the Shooting Star formation could indicate more significant participation from large traders, making the pattern more reliable.
Confirmation tools
o enhance the reliability of the Shooting Star pattern, professional traders typically look for further confirmation from other technical tools. Here are four tools that can assist in identifying a high-probability Shooting Star pattern:
| Tool | Confirmation Signal |
|---|---|
| 1. Key Levels | If the Shooting Star pattern appears near a significant resistance level, it can add credibility to the bearish reversal signal. Resistance levels can be historical price levels, Fibonacci levels, or moving averages. |
| 2. Break after Pattern Formation | A decisive bearish candle closing below the Shooting Star’s low can be a strong confirmation signal. It shows that bears have taken control, pushing prices lower. |
| 3. High Volume | If the Shooting Star pattern is accompanied by higher than average volume, it strengthens the reversal signal. High volume suggests more significant market participation in the potential reversal. |
Best settings for shooting star pattern
- Best Timeframe: The Shooting Star pattern can form on any timeframe; however, it is generally considered more reliable on longer timeframes such as the daily or weekly charts. On these timeframes, the pattern takes into account a broader scope of market activity and is less prone to market noise than on shorter timeframes.
- Trading Session: The pattern can technically form in any trading session. Yet, sessions with higher liquidity, such as the overlap of London and New York sessions for Forex trading, may provide more reliable Shooting Star patterns due to greater market participation.
- Winning Ratio: The winning ratio of the Shooting Star pattern varies based on the market, the timeframe, and individual trading strategy. As a rough estimate, some sources suggest a reliability rate of around 60%.
Shooting star candlestick trading strategy
When deploying a trading strategy around the Shooting Star pattern, it’s beneficial to incorporate an element of confluence such as key levels or support and resistance zones. Here’s a simple outline of a trading strategy:
Setup: Identify a Shooting Star candlestick pattern in a prevailing uptrend.
Confluence: Check if the pattern has formed at a key resistance level or at a supply zone where sellers are likely to enter the market. Using other technical analysis tools or indicators at this stage could provide additional confirmation.
Entry: A common entry point is the opening of the next candle after the Shooting Star, but only if it opens lower or gapped down. This signifies the bearish sentiment in the market.
Stop Loss: Set the stop loss slightly above the high of the Shooting Star candlestick. This area marks the level where the market rejected further upside, so if the price breaks this level, it’s a strong indication that the bearish reversal may not be happening.
Take Profit: Set the initial take profit target at the nearest support level or demand zone. As the price moves in favor of the trade, you may consider trailing the stop loss or implementing a step-by-step profit taking strategy.
The bottom line
In conclusion, the Shooting Star candlestick pattern is a popular tool used by traders to identify potential bearish reversals in the market. Its appearance in an uptrend, particularly at key resistance levels or supply zones, can signal a shift in market sentiment from bullish to bearish.
However, no trading strategy or pattern can guarantee success. The Shooting Star, like all trading patterns, should be used in conjunction with a robust risk management strategy. Factors such as timeframe, trading session, and personal trading style will also influence the success rate of this pattern.

