Dive into the world of forex trading with the Relative Strength Index (RSI), your essential tool for market analysis. This powerful indicator not only tracks the speed and change of price movements but also helps traders pinpoint the perfect moments to enter or exit trades. Whether you’re a seasoned trader or just starting out, understanding RSI can transform your trading strategy and boost your market success.
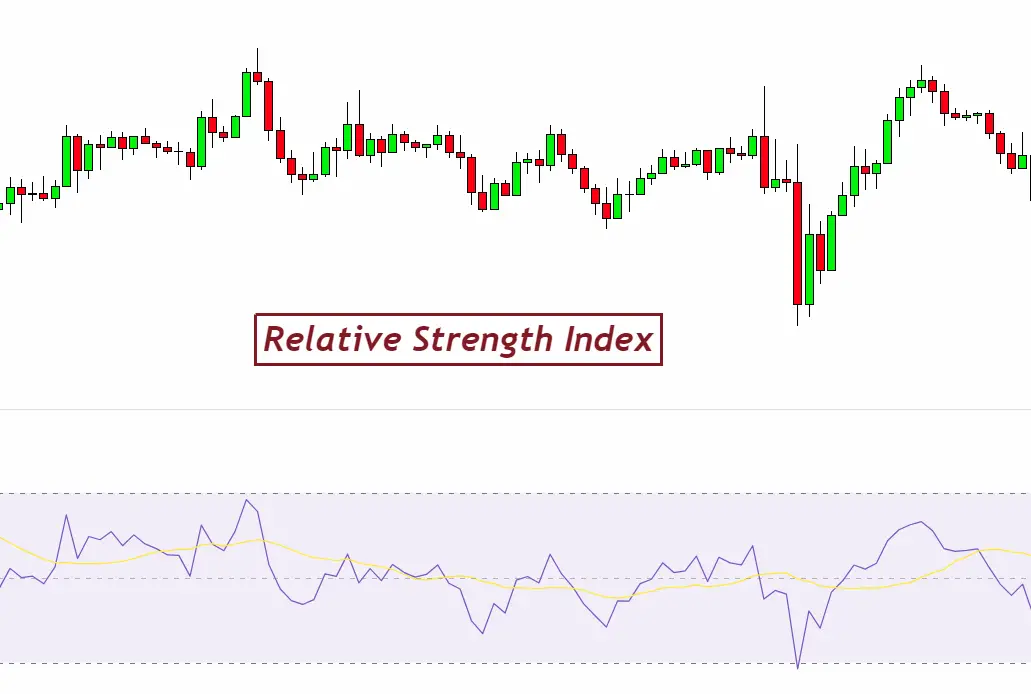
What is the Relative Strength Index (RSI)?
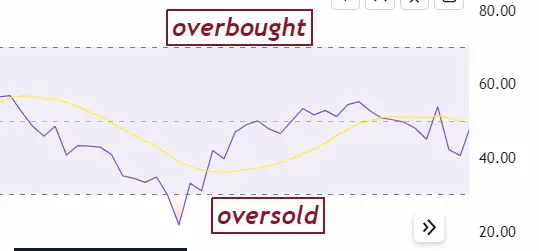
The Relative Strength Index (RSI) stands as a pivotal momentum oscillator in the forex trading realm. It measures the speed and magnitude of price movements, presenting its findings on a scale from 0 to 100. Traders primarily use RSI to gauge market conditions that are either overbought (above 70) or oversold (below 30). This insight is invaluable for predicting potential market reversals. Developed by J. Welles Wilder Jr., the RSI is calculated based on average price gains and losses over a specified period, typically 14 days. Understanding RSI is crucial for traders aiming to navigate the forex market with precision and confidence.
How RSI Enhances Your Forex Trading Strategy
Incorporating the Relative Strength Index (RSI) into your forex trading strategy can significantly enhance decision-making and market insight. Here’s how:
- Identify Market Extremes: RSI signals overbought conditions above 70 and oversold conditions below 30, guiding traders on potential trend reversals.
- Spot Divergence: Divergence occurs when price and RSI direction differ, indicating potential trend changes.
- Refine Entry and Exit Points: RSI helps pinpoint optimal moments for trade entries and exits, improving trade efficiency.
- Boost Confidence: Using RSI as part of a comprehensive trading strategy adds an extra layer of validation for your trading decisions.
Leveraging RSI effectively can lead to more informed, strategic, and successful forex trading endeavors.
RSI Settings for Optimal Use
Optimizing RSI settings is crucial for aligning the indicator with your trading strategy. Here’s how to fine-tune RSI for peak performance:
- Standard Period Setting: The default 14-period setting suits most scenarios, balancing sensitivity and reliability.
- Adjust for Style: Shorten the period for more signals in day trading. Lengthen it for fewer, more significant signals in swing trading.
- Smoothness vs. Responsiveness: A higher period number smooths the RSI line but may delay signals. A lower number increases sensitivity but risks false signals.
Experiment with these settings in a demo account to find the perfect balance for your trading approach.
Practical Tips for Using RSI
To maximize the effectiveness of the Relative Strength Index (RSI) in your forex trading strategy, consider these practical tips:
- Combine with Other Indicators: Use RSI alongside trend indicators like Moving Averages or MACD to confirm market trends and signals. This multi-indicator approach reduces false signals and enhances decision-making.
- Watch for Divergence: Pay close attention to divergence between the RSI and price action. A rising price with a falling RSI, or vice versa, can indicate a potential reversal. This is a powerful signal, especially when confirmed by other indicators or chart patterns.
- Set Appropriate Thresholds: While 70 and 30 are common thresholds for overbought and oversold conditions, adjusting these levels to 80 and 20 can help filter out noise and identify more significant opportunities in highly volatile markets.
- Use RSI in Context: Consider the overall market context and trends when interpreting RSI signals. An overbought signal in a strong uptrend might not be a sell signal but rather a pause before the trend continues.
- Apply RSI to Different Timeframes: To get a broader perspective, apply RSI across multiple timeframes. This can provide insights into the short-term and long-term momentum and help align your trades with the overall market direction.
- Practice and Patience: Like any trading tool, RSI requires practice to use effectively. Spend time observing how RSI behaves in different market conditions and with different settings. Patience is key in waiting for high-probability signals rather than jumping on every overbought or oversold reading.
By integrating these tips into your trading routine, you can enhance your use of RSI, making it a more effective tool in your forex trading arsenal.
RSI Trading Strategies
The Relative Strength Index (RSI) is not just a momentum oscillator; it’s a versatile tool that can form the backbone of multiple trading strategies. Here are some detailed RSI trading strategies to enhance your forex trading approach:
1. Overbought and Oversold Strategy
- Concept: Buy when the RSI falls below 30 (oversold), indicating potential upward reversal. Sell or short when RSI exceeds 70 (overbought), suggesting a possible downward turn.
- Application: Wait for RSI to cross back above 30 to buy or fall below 70 to sell, ensuring the market is reversing from extreme conditions.
- Risk Management: Use stop-loss orders to limit potential losses if the market does not reverse as anticipated.
2. RSI Divergence Strategy
- Concept: Divergence occurs when the RSI direction diverges from the price trend. Bullish divergence (price makes a new low, RSI does not) signals potential upward movement. Bearish divergence (price hits a new high, RSI does not) indicates possible downward trend.
- Application: Enter a trade when you observe divergence, and the price starts to move in the direction indicated by RSI.
- Confirmation: Use other indicators or candlestick patterns to confirm the reversal signaled by divergence.
3. RSI Swing Rejection Strategy
- Concept: This strategy focuses on RSI behavior around key levels (30 and 70). Look for the RSI to move into overbought or oversold territory, make a directional move back, then retest the level without crossing it, and start moving in the opposite direction.
- Application: Enter a trade when the RSI rejects the critical level on the retest and begins to move away, indicating momentum in the new direction.
- Confirmation: Confirm with candlestick patterns or volume increase on the direction change.
4. RSI Breakout Strategy
- Concept: Use RSI to identify potential breakouts by monitoring for breaks above or below key RSI levels (typically 30 and 70) that coincide with price breakouts from consolidation zones.
- Application: Enter a trade when both the price and the RSI break out from their respective patterns or levels, suggesting a strong move.
- Risk Management: Confirm the breakout with volume and use stop-loss orders to protect against false breakouts.
5. RSI Trendline Break Strategy
- Concept: Draw trendlines directly on the RSI chart, similar to price chart trendlines. A trendline break on the RSI can precede or confirm a trendline break on the price chart.
- Application: Enter a trade when the RSI breaks through a trendline, especially if this is accompanied or quickly followed by a price chart trendline break.
- Confirmation: Look for increased volume and other indicators to confirm the trendline break’s significance.
When applying these strategies, always consider the overall market context and combine RSI signals with other technical analysis tools for the best results. Practice these strategies on a demo account to understand their nuances before implementing them in live trading.
Real-World Examples
Example 1: Overbought RSI Leading to a Downtrend
- Scenario: The EUR/USD pair has been on a steady uptrend, pushing the RSI above the 70 level, indicating an overbought condition.
- Action: Traders observing the RSI surpass 70 begin to monitor for signs of a reversal. As the RSI starts to decline, indicating weakening momentum, some traders might decide to take profits or enter short positions.
- Outcome: Shortly after the RSI indicates an overbought condition, the price of EUR/USD peaks and starts a downward correction, rewarding traders who anticipated the reversal based on the RSI reading.
Example 2: Bullish Divergence Signaling an Uptrend
- Scenario: The USD/JPY pair is in a downtrend, and the RSI drops below 30, signaling an oversold condition. However, upon a subsequent lower low in the price, the RSI makes a higher low, indicating a bullish divergence.
- Action: Traders spotting the bullish divergence wait for the RSI to rise back above 30 as a confirmation and then consider buying opportunities, expecting a potential reversal or correction.
- Outcome: The bullish divergence is followed by a significant uptrend in USD/JPY, rewarding traders who used the divergence as a signal to enter long positions.
Example 3: RSI Swing Rejection during a Range-Bound Market
- Scenario: The GBP/USD pair is trading within a tight range, causing the RSI to oscillate between 40 and 60, mostly staying away from the extreme levels. However, at one point, the RSI dips just below 30 but quickly reverses and climbs back, forming a “swing rejection” pattern.
- Action: Traders observing the swing rejection pattern, especially with the RSI climbing back above 30, view this as a buying signal, anticipating a short-term bullish move within the range.
- Outcome: The swing rejection is followed by a rally towards the upper end of the trading range, benefiting traders who interpreted the RSI swing rejection as a bullish signal.
These examples illustrate how traders might use the RSI indicator in various market conditions to make informed trading decisions. It’s important to remember that while the RSI is a powerful tool, it works best when combined with other analysis methods and proper risk management practices.
Conclusion
The Relative Strength Index (RSI) is an indispensable tool in the forex trader’s arsenal, offering deep insights into market momentum and potential turning points. By identifying overbought and oversold conditions, signaling divergences, and providing confirmation for other technical analysis tools, RSI empowers traders to make more informed decisions. Whether you’re a beginner or an experienced trader, incorporating RSI into your trading strategy can enhance your ability to navigate the complexities of the forex market.
However, it’s crucial to remember that no indicator is foolproof. Successful trading involves a blend of indicators, thorough market analysis, and a solid risk management strategy. Practice with RSI in a demo account, experiment with its settings, and learn to interpret its signals in conjunction with other market data. As you gain confidence and experience, you’ll find that RSI is not just an indicator but a guide to more strategic and profitable trading.
Keep learning, stay disciplined, and let RSI guide you toward smarter trading decisions in the dynamic world of forex.

