Definition:
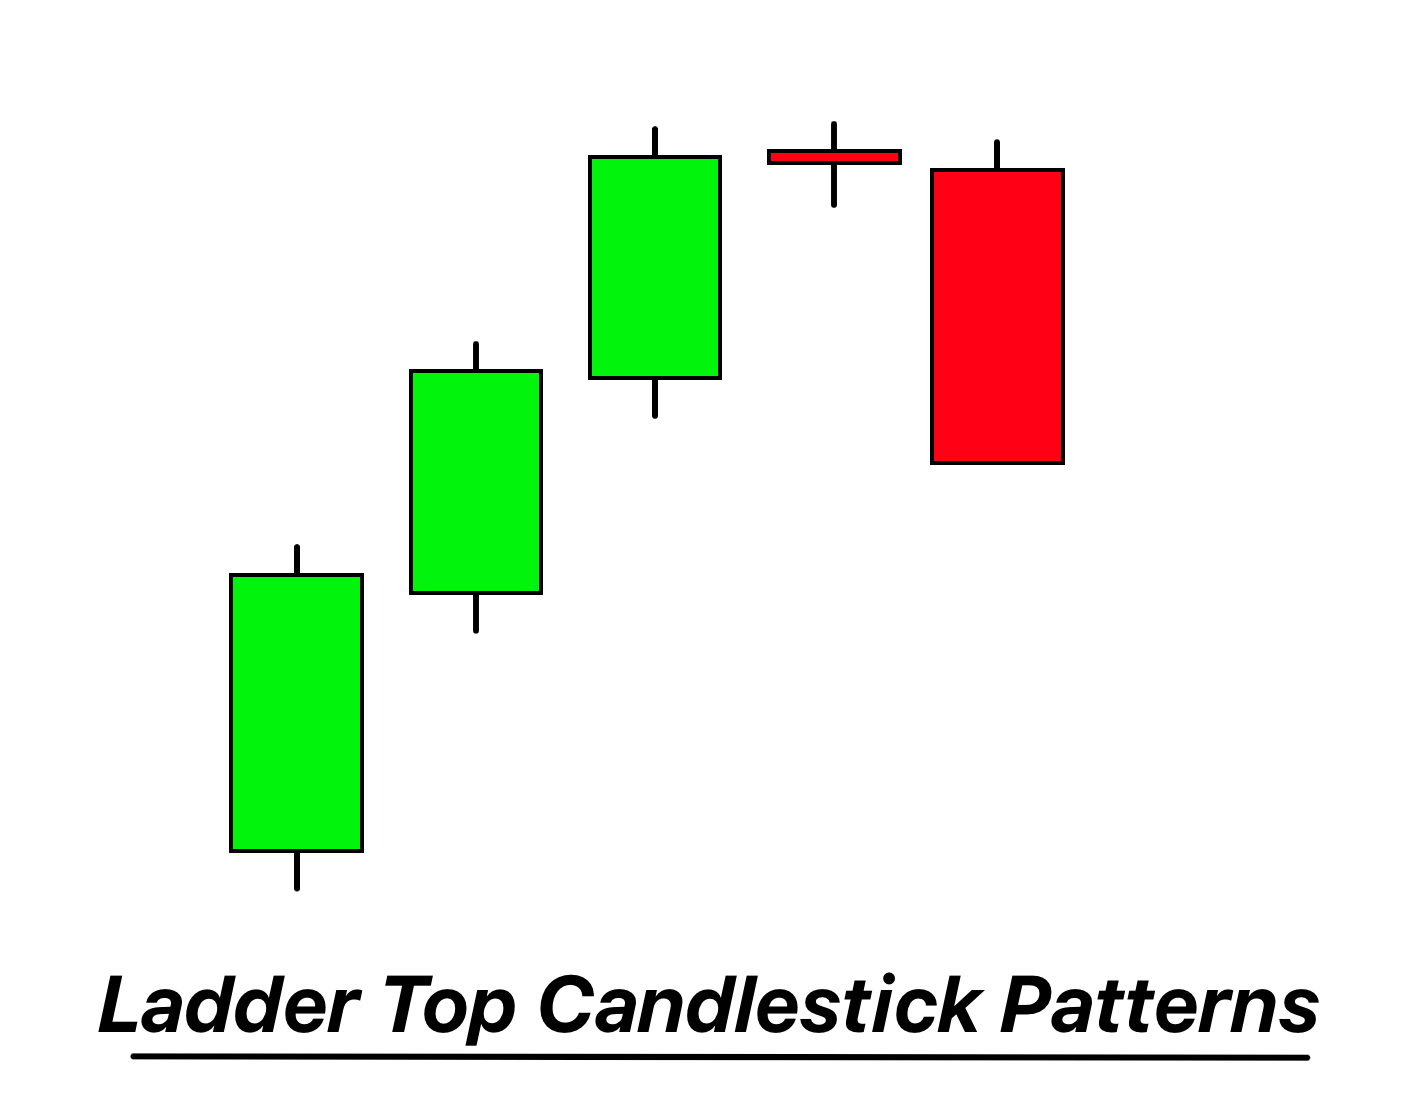
The Ladder Top Candlestick Pattern is a five-candle bearish reversal formation characterized by three consecutive long-bodied bullish candles with progressively higher highs and closes, followed by two bearish candles with lower highs and lower closes.
Signifying a potential end to a bullish trend, the Ladder Top Pattern warns traders of weakening upward momentum and the possible onset of a bearish reversal.
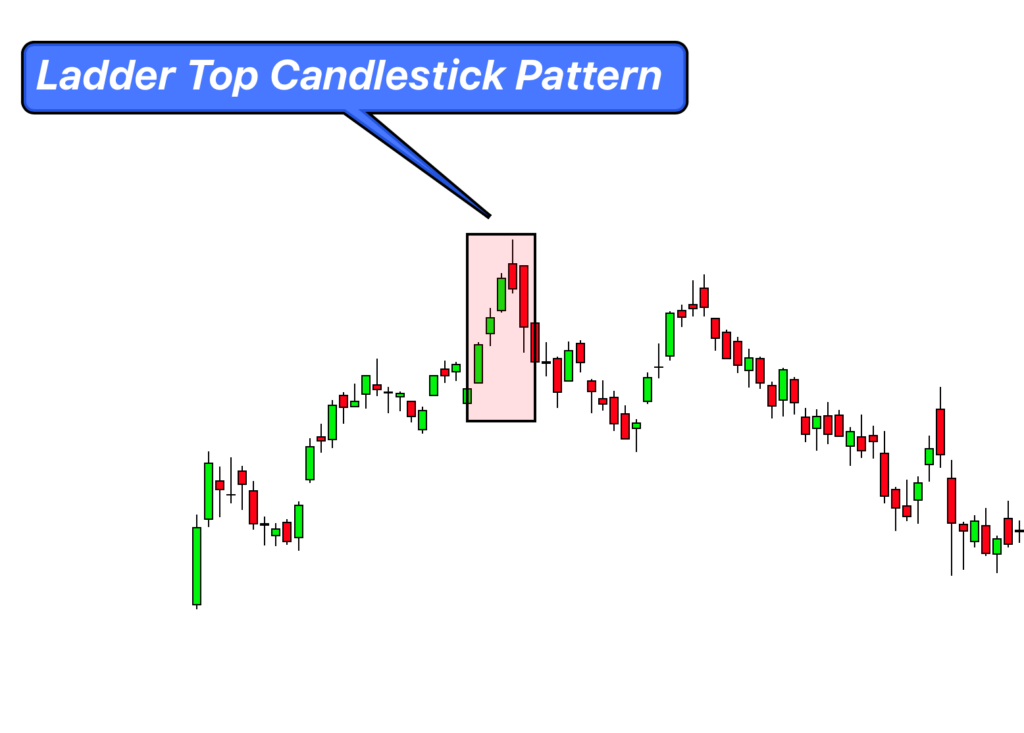
How to Identify the Ladder Top Candlestick Pattern on a Chart:
- Bullish Precedence: The pattern should form during a clear uptrend, ensuring its relevance as a bearish reversal signal.
- First Three Candles: Look for three consecutive long-bodied bullish (green or white) candles. Each of these candles should have:
- Higher highs than the previous candle.
- Higher closes than the previous candle.
- Fourth Candle: The fourth candle should be bearish (red or black). While it doesn’t need to be long-bodied, it should:
- Have a lower high than the third candle.
- Close below the high of the third candle but can close above its own open.
- Fifth Candle: The fifth and final candle should also be bearish, reinforcing the reversal signal. It should:
- Have a lower high than the fourth candle.
- Close lower than the fourth candle, ideally below its open.
- No Gaps: Unlike some other patterns, the Ladder Top doesn’t require gaps between the candles. The candles can be adjacent to each other.
- Volume Consideration: While not a strict requirement, a decrease in volume during the formation of the first three candles, followed by an increase in volume on the fourth and fifth candles, can add validity to the pattern.
Significance and Indications
- End of Bullish Momentum: The Ladder Top Pattern is a strong indication that the bullish momentum, which was previously driving the price upward, is waning. The first three candles show a diminishing strength in the bulls, and the last two candles confirm the bears are taking control.
- Potential Trend Reversal: While many patterns might suggest a pause or minor pullback in the trend, the Ladder Top is a more potent signal of a potential complete trend reversal from bullish to bearish.
- Psychological Shift: The pattern reflects a shift in market psychology. The initial bullish sentiment, evident in the first three candles, is overtaken by a growing bearish sentiment in the subsequent two candles.
- High Reliability: Due to its five-candle structure and clear progression, the Ladder Top is considered a more reliable pattern compared to some shorter formations. When it appears, traders take notice.
- Confirmation is Crucial: As with all candlestick patterns, it’s wise to seek additional confirmation before acting on the Ladder Top. This could be in the form of other technical indicators signaling a bearish turn or a break below a significant support level.
- Volume Dynamics: An ideal Ladder Top formation would see diminishing volume during the rise of the first three candles and an increase in volume as the bearish candles form. This volume pattern reinforces the idea of bulls losing control and bears stepping in with conviction.
Activity of Big Traders During the Formation of the Ladder Top Candlestick Pattern:
- Position Reduction: When institutional or big traders recognize the initial signs of the Ladder Top, they might begin to reduce their long positions. This gradual exit can be seen in the diminishing volume during the formation of the first three candles.
- Hedging Actions: Sensing a potential trend reversal, institutional traders might initiate or increase their hedging strategies. This could involve purchasing put options, shorting futures, or employing other derivative-based protective measures.
- Volume Analysis: A noticeable increase in volume during the formation of the last two bearish candles can be indicative of big traders actively establishing bearish positions or accelerating their exit from bullish ones.
- Order Flow Insights: Tools like Level 2 or Time & Sales can provide a glimpse into the order flow. Large block trades or a series of significant sell orders can hint at institutional activity, signaling their bearish bias.
- Liquidity Hunting: Big traders, due to the sheer size of their trades, often seek areas of liquidity to minimize slippage. If the Ladder Top forms near significant resistance levels, and those levels are subsequently tested with increased volume, it can suggest that big traders are offloading positions.
- Sentiment Analysis Tools: Instruments like the Commitment of Traders (COT) report can shed light on the positions of large speculators. A shift towards a more bearish stance by these traders around the time the Ladder Top forms can be a corroborative signal.
- Contrarian Approaches: It’s essential to remember that not all institutional traders will interpret or act on the pattern uniformly. Some might see the formation as an opportunity for a contrarian play, especially if other macroeconomic or fundamental factors support a bullish stance.
For retail traders, understanding the potential maneuvers of big traders during the Ladder Top’s formation can offer invaluable insights.
Confirmation Tools for the Ladder Top Candlestick Pattern: Enhancing Trade Probability
| Tool/Indicator | Description |
|---|---|
| Key Support/Resistance Levels | The pattern’s strength is amplified if it forms near a significant resistance level. A subsequent break below a nearby support level post-pattern can be a strong bearish confirmation. |
| Break of Low After Pattern Formation | A decisive break below the low of the fifth candle (of the Ladder Top Pattern) can indicate a strong bearish momentum and validate the pattern’s reversal implication. |
| Volume Analysis | An uptick in volume, especially during the formation of the last two bearish candles, suggests a stronger shift in sentiment and heightened selling interest. |
| Technical Indicators (e.g., RSI, MACD) | Bearish divergences or overbought conditions in indicators like RSI or a bearish MACD crossover can reinforce the pattern’s bearish reversal signal. |
Optimal Trading Conditions
Best Timeframe: For the Ladder Top, the daily and weekly charts are most reliable, offering clearer insights into broader market sentiment and trend reversals.
Trading Session: Ensure you’re analyzing the pattern during the primary trading hours of the respective market (e.g., 9:30 AM – 4:00 PM EST for U.S. stocks) to capture the bulk of institutional activity and true market sentiment.
Winning Ratio: With proper confirmation tools and disciplined execution, the Ladder Top Pattern can yield a winning ratio of approximately 60-70%.
Ladder Top Candlestick Pattern: Trading Strategy with Confluence
1. Entry: After the formation of the Ladder Top, wait for a subsequent candle that breaks below the low of the fifth candle. If this break is accompanied by other bearish confluence factors, such as a technical indicator signaling a sell, this can be your entry point.
2. Stop-Loss: Set the stop-loss slightly above the high of the fifth candle. This ensures you’re protected if the pattern fails and the price unexpectedly surges upwards.
3. Take Profit: Aiming for a risk-reward ratio of at least 1:2 is a prudent approach. If your stop-loss is set 10 pips above your entry, consider setting a take profit 20 pips below your entry. Alternatively, target the next significant support level for potential profit-taking.
4. Confluence Factors: To enhance the reliability of the trade:
- Monitor technical indicators like RSI or MACD for bearish signals.
- Observe volume dynamics, with increased volume on the bearish breakout being a positive sign.
- Consider the pattern’s relation to major support and resistance levels. A formation near a significant resistance can add to its validity.
Conclusion
The Ladder Top Candlestick Pattern is a robust bearish reversal signal, especially when combined with other confluence factors. While it offers a clear structure for potential trade setups, traders should always employ proper risk management and seek additional confirmations to enhance the pattern’s reliability. Acting on high-probability setups and being aware of the broader market context can significantly increase the success rate when trading this pattern.

