Definition:
A Failed Head and Shoulders Pattern occurs when the price action violates the expected breakout or breakdown of the classic head and shoulders pattern, indicating a potential continuation of the prevailing trend. Contrary to the classic reversal indication of the head and shoulders pattern, a failed version can offer traders insights into the strength of the current market direction, suggesting that prevailing forces remain dominant.
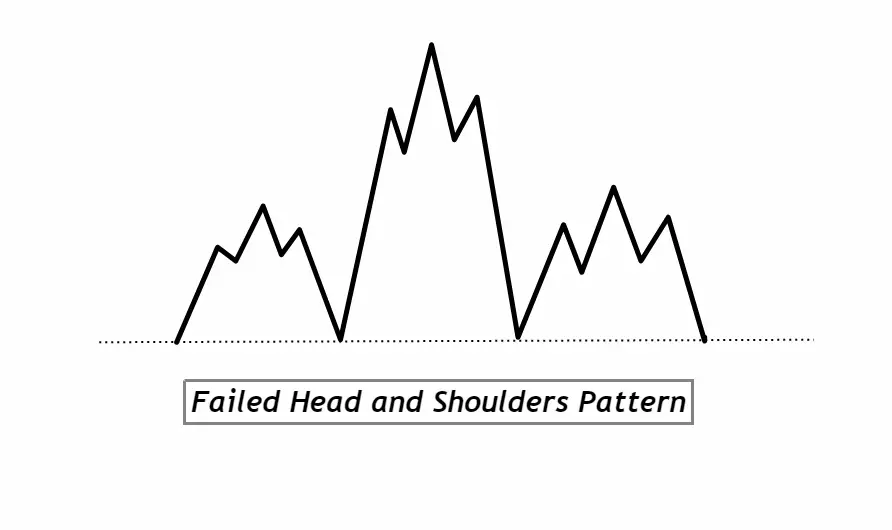
Failed Head and Shoulders Pattern on a chart
- Establish the Prevailing Trend: Before the formation starts, there should be a clear trend in place, either bullish (for a potential inverted pattern) or bearish (for a potential classic pattern).
- Left Shoulder Formation: Look for a peak (in a bearish trend) or a trough (in a bullish trend) which forms the left shoulder. It’s the beginning of the potential pattern.
- Head Formation: After the left shoulder, price should move to form a higher peak (for a bearish trend) or a deeper trough (for a bullish trend) than the left shoulder, which is called the head.
- Right Shoulder Formation: Following the head, the price should make a peak/trough similar in height/depth to the left shoulder, but not exceeding the head.
- Neckline: Draw a line connecting the lows (for a bearish trend) or highs (for a bullish trend) after the left shoulder and head. This line acts as a potential breakout/breakdown point.
- Violation of Expectation: Instead of breaking and closing beyond the neckline in the anticipated reversal direction:
- For a classic pattern (bearish trend): Instead of breaking below the neckline to signal a reversal, price breaks above the right shoulder.
- For an inverted pattern (bullish trend): Instead of breaking above the neckline to signal a reversal, price breaks below the right shoulder.
- Volume Consideration: Ideally, volume should decrease as the pattern forms and then pick up in the direction of the prevailing trend during the failure, indicating strong continuation sentiment.
- Confirmation: Wait for a strong candle close in the continuation direction of the prevailing trend (above the right shoulder for a bearish trend or below the right shoulder for a bullish trend) to confirm that it’s a failed pattern.
The significance and indications of this chart pattern like a professional trader
Significance & Market Psychology: The Failed Head and Shoulders Pattern stands as a testament to the strength of the prevailing market trend. Initially, the formation of a head and shoulders pattern might give traders the anticipation of a potential reversal. However, when this pattern fails, it reveals that the dominant market participants (either buyers or sellers) have retained their control. The failure itself is a strong psychological indicator that the market isn’t ready to change direction.
Reliability & Confirmation: From a trading perspective, patterns that don’t play out as textbook expectations can offer some of the most reliable signals. This is because they trap the traders acting on the classic pattern, amplifying the move in the opposite direction. A failed pattern’s breakout or breakdown, confirmed with volume, provides an excellent entry point as it rides the wave of trapped traders scrambling to exit their positions.
Risk Management: The clearly defined structure of the Failed Head and Shoulders Pattern allows traders to place tight stop-loss orders. Typically, a stop can be placed just beyond the neckline or the extremity of the head, ensuring minimal risk. This risk-to-reward ratio is favorable since the price move after a pattern failure can be substantial.
Beneficial for New Traders: For novices, this pattern serves as a reminder of the unpredictability of markets and the importance of confirmation. Rather than jumping the gun on seeing a classic pattern, waiting for a clear indication (like a pattern failure) can provide more conviction in a trade. Moreover, recognizing a failed pattern can be an essential skill, offering new traders unique opportunities with defined risk parameters.
In essence, the Failed Head and Shoulders Pattern underscores the dynamic nature of markets and provides traders with a unique vantage point, blending both classic charting knowledge with the practical nuances of real-market behavior.
The activities of big traders or institutional players
Understanding the activities of big traders or institutional players can shed light on the mechanics behind the formation of the Failed Head and Shoulders Pattern.
Initial Formation & Institutional Play: As the head and shoulders pattern starts to form, many retail traders might interpret this as a reversal signal. Institutional traders, being aware of this perception, might initially reduce their positions, leading to the head’s formation, giving an illusion of potential trend reversal. This partial offloading can create the initial impression of the pattern.
Trap Setting & Sudden Shift: As the right shoulder begins to form and the price approaches the neckline, many retail traders prepare for the anticipated breakout/breakdown. At this juncture, institutional players can start accumulating (in case of a bullish prevailing trend) or distributing (in case of a bearish prevailing trend) their positions stealthily. They use the liquidity provided by retail traders acting on the classic head and shoulders pattern to facilitate this.
The “Failure” & Strong Move: When the pattern “fails” and moves in the direction of the prevailing trend, it’s often a concerted push by big traders. They’ve accumulated or distributed enough to fuel a strong move, and this action traps the retail traders who tried to play the classic reversal. The resulting scramble to exit their positions only amplifies the move, with institutional players benefitting from the momentum.
Volume as a Clue: A discerning eye can often spot the hand of institutional traders by observing volume. A sudden surge in volume during the failure of the pattern, in the direction of the prevailing trend, can indicate the involvement of big players. This volume surge is a mix of institutions further building their position and retail traders exiting theirs.
In essence, the Failed Head and Shoulders Pattern can sometimes be a strategic play by big traders to trap the unwary, capitalize on the liquidity they provide, and drive the market in their desired direction. Retail traders, understanding this dynamic, can avoid being caught off-guard and instead align their strategies with these larger market forces.
Confirmation Tools for the Failed Head and Shoulders Pattern
| Tool | Description |
|---|---|
| 1. Key Levels | Ensure the failed breakout/breakdown occurs near a significant support or resistance level, enhancing the pattern’s validity. |
| 2. Break of Extremities | Monitor the break of the high (for bearish trend) or low (for bullish trend) after the right shoulder, signaling the continuation of the prevailing trend. |
| 3. High Volume | A surge in volume during the failure of the pattern indicates strong participation, often signifying institutional involvement and adding weight to the pattern’s reliability. |
| 4. Momentum Indicators | Utilize indicators like the Relative Strength Index (RSI) or the Moving Average Convergence Divergence (MACD). A bullish divergence in a bearish trend or a bearish divergence in a bullish trend can suggest weakening momentum of the anticipated reversal and hint towards a potential pattern failure. |
Utilizing these tools in tandem can provide traders with a more robust and high-probability confirmation of the Failed Head and Shoulders Pattern, ensuring they’re not just trading based on the pattern’s appearance alone.
Optimal Conditions for Trading the Failed Head and Shoulders Pattern
Best Timeframe: For enhanced reliability, the daily timeframe is often preferred. It filters out intra-day noise and captures the broader sentiment of the market, ensuring the pattern is representative of a larger cohort of traders.
Trading Session: Trading during the major market sessions, like the London or New York open, can offer increased liquidity and more pronounced moves. These sessions witness higher institutional activity, which can amplify the pattern’s dynamics.
Winning Ratio: While individual results may vary, a well-executed strategy around this pattern can offer a winning ratio of approximately 60-70%. However, always ensure risk management practices are in place, as no pattern is foolproof.
Trading Strategy with Confluence for the Failed Head and Shoulders Pattern
1. Confluence: Before making an entry decision, seek confluence from other technical tools. This could be a combination of Fibonacci retracement levels aligning with the pattern, moving averages, or even other chart patterns forming simultaneously. The more confluence, the higher the probability of the pattern playing out.
2. Entry: Enter the trade after a confirmed failure of the pattern:
- For a classic pattern (bearish trend): Go long when the price breaks above the right shoulder with substantial volume.
- For an inverted pattern (bullish trend): Go short when the price breaks below the right shoulder with significant volume.
3. Stop-Loss: Place the stop-loss just beyond the neckline or at the extremity of the head, depending on your risk tolerance. This ensures a minimal loss if the pattern sees a late-stage reversal or if it was a false failure.
4. Take Profit: A conservative target can be the height of the pattern projected from the breakout/breakdown point. Alternatively, use key resistance (for bullish moves) or support (for bearish moves) levels as profit targets. Always consider adjusting the take profit based on evolving market conditions and other technical factors.
Conclusion:
The Failed Head and Shoulders Pattern offers a unique opportunity to trade market continuations, capturing the dynamics of trapped traders. By adding confluence and adhering to a structured strategy, traders can harness the power of this pattern, making informed decisions that align with broader market sentiment. As always, risk management remains paramount to ensure sustainability and success in the trading journey.

