A Doji Star is a candlestick pattern characterized by a very small body, signaling market indecision as the opening and closing prices are virtually equal, with shadows (or wicks) that can be varying lengths.
The Doji Star is a potent indicator of potential reversals in the price trend, demonstrating an equilibrium between buying and selling pressure.
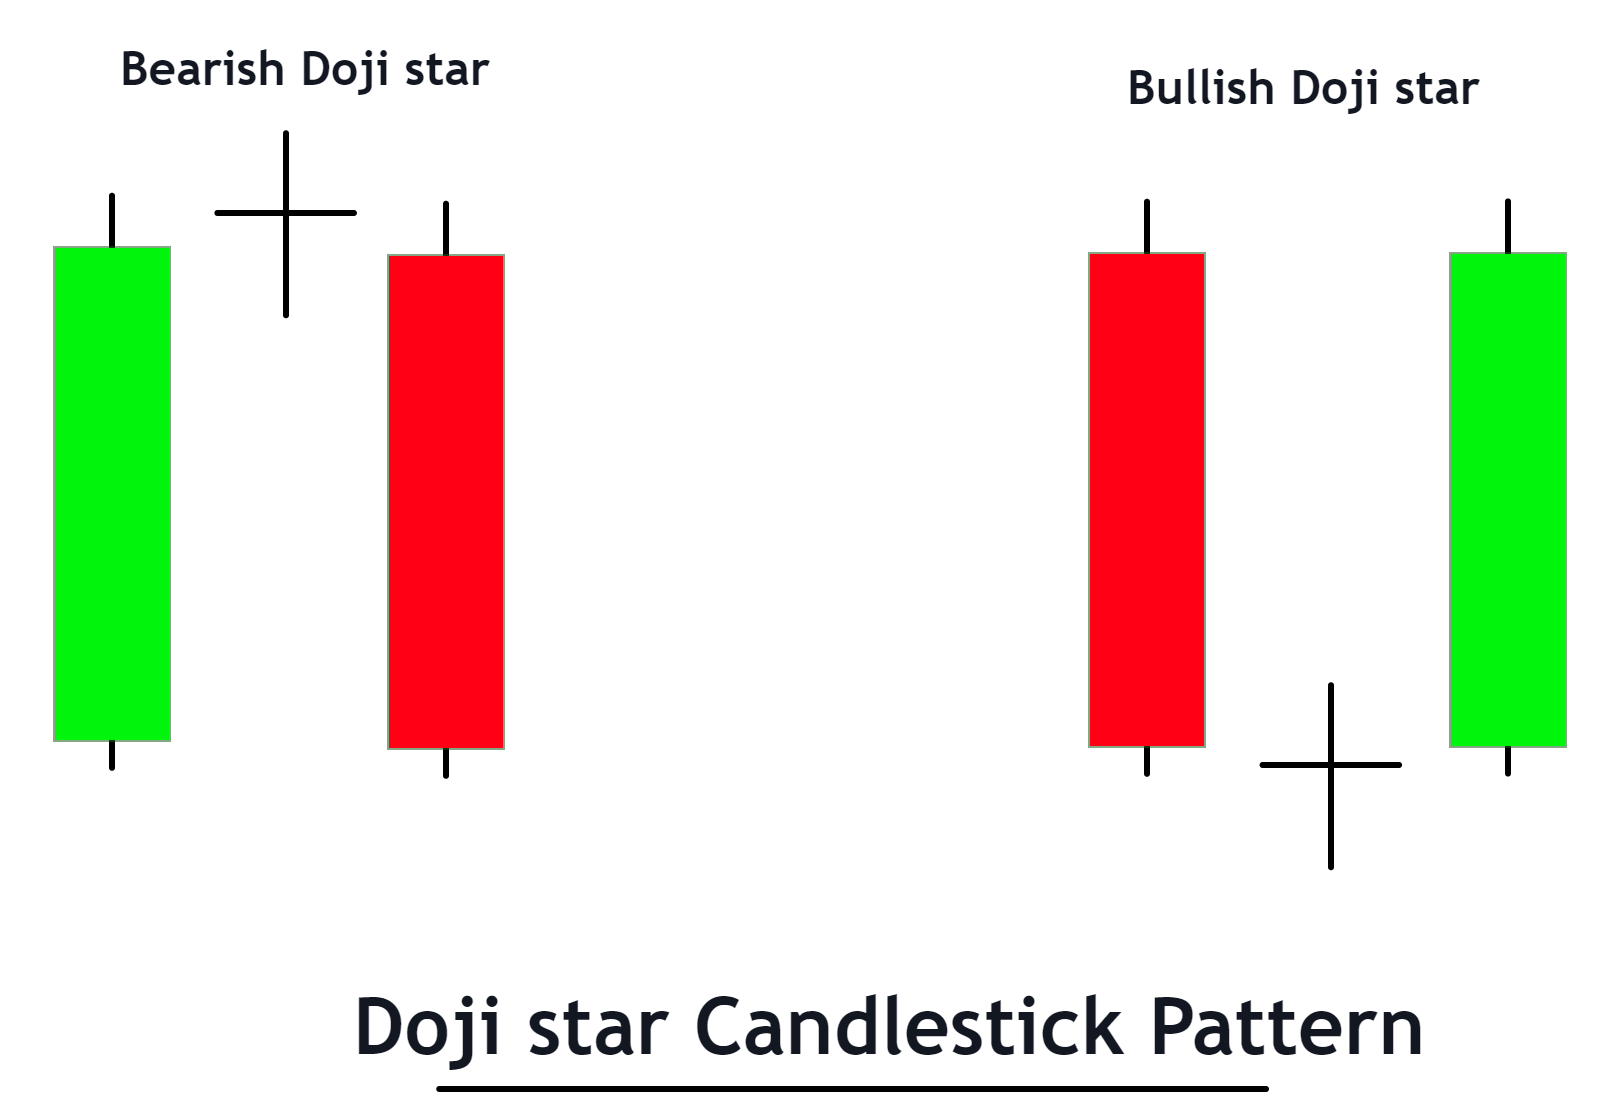
Structure of Doji Star Candlestick
To identify the Doji Star candlestick pattern on a chart, follow these steps:
- Candle Body: Look for a candle with a very small body, which appears as a thin line. The opening and closing prices of this candle are nearly the same, indicating a close balance between buyers and sellers during the period.
- Candle Wicks: The Doji Star can have long or short shadows (also known as wicks), but the key factor is the negligible body of the candle. Some variants like the Long-Legged Doji will have longer wicks, while others may have shorter ones.
- Preceding Trend: The Doji Star is significant when it appears after a prolonged uptrend or downtrend. After an uptrend, it can signal that buying pressure is diminishing, while after a downtrend, it indicates a decrease in selling pressure.
- Position in the Chart: The Doji Star typically occurs at the peak of an uptrend or the bottom of a downtrend. Its position relative to previous candles can aid in understanding the market sentiment.
Significance
The Doji Star candlestick pattern holds significant implications for traders. Here are its primary significances and indications:
- Market Indecision: A Doji Star represents a state of market indecision where neither the buyers nor the sellers have gained control. This can often indicate a potential turning point in the market, hinting that the current trend might be losing steam.
- Potential Trend Reversal: When a Doji Star occurs after a prolonged uptrend or downtrend, it often suggests a possible trend reversal. After an uptrend, it may signify that buyers are losing their grip, and after a downtrend, it can imply that sellers are running out of steam.
- Confirmation Required: It’s essential to wait for confirmation following a Doji Star. A bullish candle following a Doji Star in a downtrend or a bearish candle following a Doji Star in an uptrend can validate the potential reversal.
- Volume Analysis: The Doji Star coupled with high trading volume can signify a stronger reversal signal. High volume shows a significant level of investor interest and potential for a shift in sentiment.
Activity of Big Traders during formation of Doji Star
When a Doji Star pattern forms, it often reflects certain activities of big traders or institutions, which can be beneficial for retail traders to understand:
- Potential Shift in Sentiment: The formation of a Doji Star suggests that the sentiment among big traders might be shifting. If this pattern appears after an uptrend, it could mean that big traders are beginning to sell, and if it appears after a downtrend, it could indicate they are starting to buy.
- Position Adjustments: The Doji Star’s emergence could signal that big traders are adjusting their positions—closing their existing trend-following positions and possibly preparing for a counter-trend move.
- Caution and Indecision: A Doji Star represents a period of indecision, even among big traders. They could be unsure about the future direction of the market, leading to balanced buying and selling pressure and the resultant Doji Star.
- Awaiting Confirmation: Like retail traders, big traders also tend to wait for confirmation following a Doji Star. They might watch for further price action or other indicators to confirm a potential trend reversal before making substantial position changes.
For retail traders, it’s beneficial to understand these potential actions of big traders.
Confirmation Tools
here’s a table of four potential confirmation tools that could increase the validity of a Doji Star pattern:
| Confirmation Tool | Description |
|---|---|
| Key Levels | Doji Stars are more significant when they occur near known support or resistance levels. This could indicate a strong reaction to these price levels and a possible trend reversal. |
| Break of High/Low | Following a Doji Star, a break above the high of the Doji Star in a downtrend or below the low in an uptrend can confirm the potential trend reversal. |
| High Volume | A Doji Star accompanied by high trading volume can be a stronger reversal signal. This high volume reflects significant trader interest and possible change in sentiment. |
| Other Technical Indicators | Use other technical indicators to confirm the potential reversal. For example, bullish divergence on the RSI or MACD in a downtrend or bearish divergence in an uptrend can strengthen the reversal signal. |
Important Points
Best Timeframe: The Doji Star pattern can be observed on all timeframes, but it’s generally more reliable on longer timeframes like the daily (D1) or weekly (W1) charts. These longer timeframes help filter out intraday market noise and give a clearer signal of potential reversals.
Trading Session: The Doji Star pattern can form in any trading session, but its significance might be enhanced during high liquidity periods. For instance, in Forex trading, the overlap of the London and New York sessions typically offers high liquidity and potentially more reliable signals.
Winning Ratio: As with any trading pattern, the success rate of the Doji Star varies based on various factors like market conditions, the trader’s skill, and the use of additional confirming signals. However, when properly confirmed and traded, it’s estimated to have a winning ratio in the range of 60-70%.
Trading Strategy
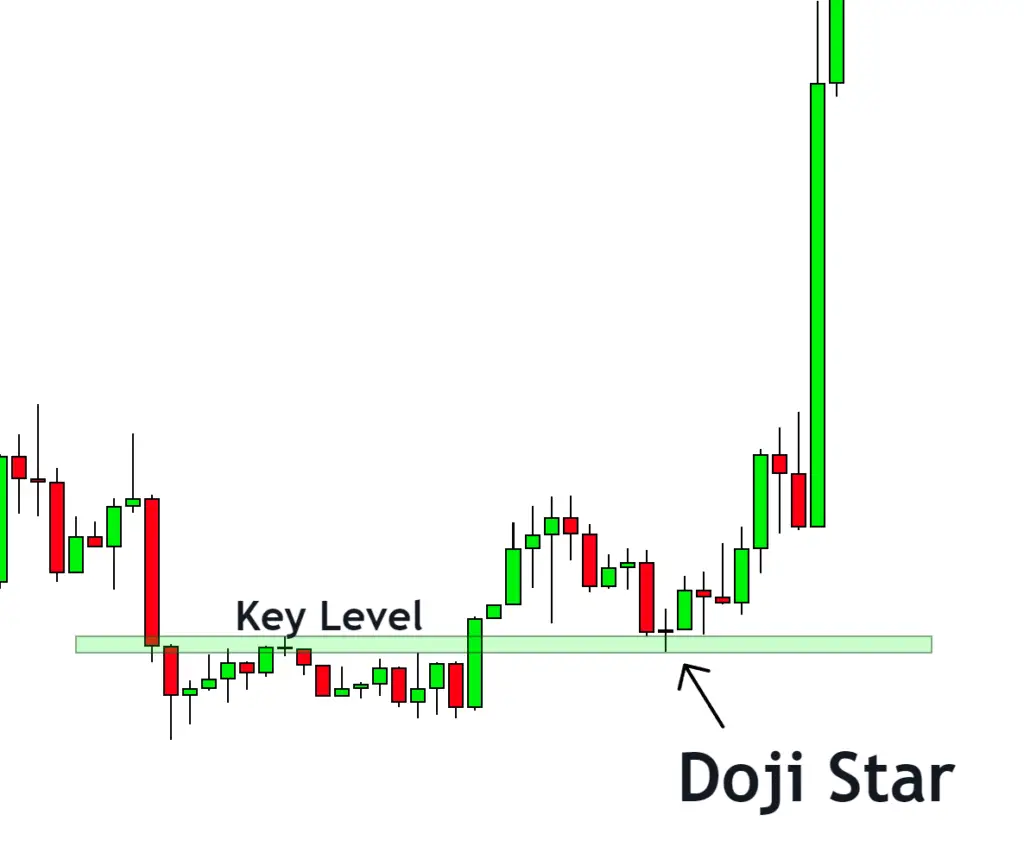
- Identifying the Pattern: Look for the Doji Star pattern forming near a known support level in a downtrend or resistance level in an uptrend. This confluence increases the probability of a successful trade.
- Entry Point: After the Doji Star, wait for a confirmation candle in the expected direction. If you’re in a downtrend, a bullish candle after the Doji Star can be your entry signal. In an uptrend, a bearish candle following the Doji Star signals a potential short position.
- Stop Loss: In a bullish reversal, the stop loss can be set just below the low of the Doji Star or the support level. For a bearish reversal, set it slightly above the high of the Doji Star or the resistance level. This ensures you’re out of the trade if the price doesn’t move in the anticipated direction.
- Take Profit: The take profit level can be set at the next significant resistance level for a bullish reversal or support level for a bearish reversal. Alternatively, you can use a risk/reward ratio to set your take profit level. If your risk (distance from entry to stop loss) is $1 per share, aim for a return of $2-3 per share.
Conclusion
The Doji Star is a potent candlestick pattern that signals potential price reversals. When found at key support or resistance levels, it can be a useful tool in a trader’s toolkit. However, like any trading pattern, it’s not foolproof and should be used in conjunction with other technical analysis tools and good risk management practices for the best results.

