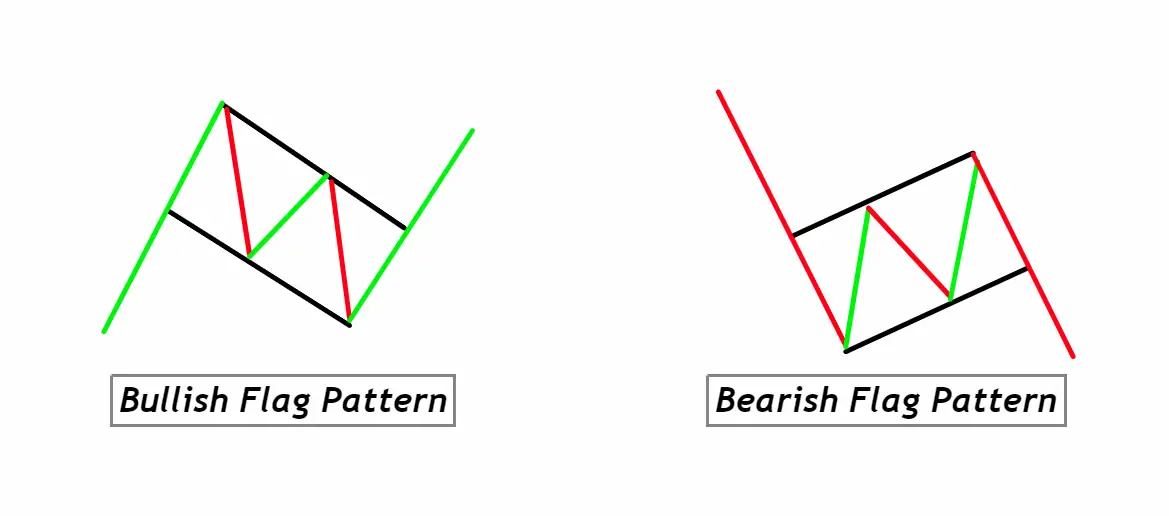
Bullish Flag Pattern:
A short-term consolidation following a strong upward move, indicating potential continuation of the uptrend.
Bearish Flag Pattern:
A short-term consolidation after a sharp downward move, signaling potential continuation of the downtrend.
Flag patterns, whether bullish or bearish, are classic chart formations that traders use to predict potential continuations in the prevailing trend.
Identifying Bullish & Bearish Flag Patterns on a Chart:
- Prevailing Trend:
- Bullish Flag: Look for a strong upward move (the flagpole) before the pattern. This often comes with increasing volume.
- Bearish Flag: Seek a sharp downward move (the flagpole) preceding the pattern, typically with increasing volume.
- Flag Formation:
- Bullish Flag: A short-term consolidation or downtrend (the flag) that slopes slightly downward, typically set against the prevailing uptrend.
- Bearish Flag: A short-term consolidation or uptrend (the flag) that slopes slightly upward, typically set against the prevailing downtrend.
- Volume:
- Bullish Flag: Volume typically diminishes during the formation of the flag and can increase again on the breakout above the flag.
- Bearish Flag: Volume usually decreases as the flag forms and can surge again on the breakout below the flag.
- Flag Boundaries:
- Use trendlines to connect the highs and lows within the flag. This will help visualize the flag’s “channel” and identify potential breakout or breakdown points.
- Breakout Confirmation:
- Bullish Flag: A breakout above the upper trendline of the flag (often with increased volume) can signal the continuation of the uptrend.
- Bearish Flag: A breakdown below the lower trendline of the flag (typically with increased volume) can indicate a continuation of the downtrend.
- Duration:
- Flag patterns are typically short-term patterns that last between one and four weeks. If they persist for too long, the validity of the pattern as a continuation signal might diminish.
Significance and Indications of Flag Patterns:
1. Strong Trend Confirmation:
Flag patterns are predominantly seen as continuation patterns. When traders spot a flag formation after a significant price movement, it reinforces the belief in the strength and momentum of the prevailing trend. For instance, after a strong upward rally, a bullish flag suggests that the upward movement is likely not a fluke but a genuine indication of a strong bullish sentiment in the market.
2. Defined Entry and Exit Points:
For traders, one of the most challenging aspects of trading can be determining when to enter or exit a position. Flag patterns provide relatively clear boundaries: the breakout or breakdown points. When prices break these boundaries, especially on higher volumes, it offers traders a signal to potentially enter (in the direction of the trend continuation) or to tighten stop-losses (for contrarian positions).
3. Risk Management:
The well-defined structure of flag patterns also assists traders in risk management. By understanding where the pattern invalidates (for instance, a bearish breakout in a bullish flag), traders can set stop-losses accordingly. This ensures that even if the market moves contrary to their position, potential losses are minimized.
4. Confluence with Other Indicators:
Flag patterns can be combined with other technical analysis tools, such as oscillators, volume indicators, or moving averages, to enhance the validity of a trading signal. When multiple indicators converge in agreement with the flag pattern’s direction, it provides traders with increased confidence in their decision-making and further underscores the pattern’s significance in the technical analysis toolkit.
Activity of Big Traders during Flag Patterns Formation:
1. Accumulation and Distribution:
When flag patterns form, especially after a pronounced movement, it’s often an indication of larger traders or institutions either accumulating (in the case of bullish flags) or distributing (in the case of bearish flags) their positions. This activity is essentially them taking advantage of the momentum to either build (bullish) or offload (bearish) significant positions without dramatically impacting the market price.
2. The Quiet Before the Storm:
During the formation of the flag, there’s often a noticeable reduction in volume. This decrease can be seen as the “calming” period where big traders are less active, allowing the market to consolidate. Retail traders should be attentive during this phase because once institutional activity resumes, it often leads to the breakout or breakdown moment, triggering the continuation of the prevailing trend.
3. Testing the Waters:
Big traders often test the market’s resilience by placing large orders at key levels to gauge the market’s reaction. If, for instance, during a bullish flag, large buy orders are placed and the price doesn’t surge drastically, it can be an indication that the prevailing bullish sentiment remains strong. Conversely, if prices drop significantly on such orders, it might hint at potential weakness in the trend.
4. Price Manipulation:
Sometimes, large traders might induce false breakouts or “stop hunts” to shake out weak hands. For example, a slight move below a bullish flag might trigger retail stop-losses, after which the price quickly reverses upwards. This can be seen as a tactic to accumulate more assets at a better price before the actual trend continuation.
For retail traders, understanding the behind-the-scenes activity of institutional or big traders is crucial. It’s not just about recognizing patterns but also about discerning the larger forces at play. By reading these subtle cues, retail traders can align their strategies more closely with the market’s dominant players, thereby enhancing their trading edge.
Flag Pattern Confirmation Table: High Probability Tools for Validation
| Tool | Bullish Flag Confirmation | Bearish Flag Confirmation |
|---|---|---|
| Key Level Break | Breakout above the upper trendline of the flag. | Breakdown below the lower trendline of the flag. |
| Volume Confirmation | Increase in volume during the breakout, surpassing recent averages. | Increase in volume during the breakdown, exceeding recent averages. |
| Support & Resistance Levels | After breakout, previous resistance turns into support. | After breakdown, previous support becomes new resistance. |
| Oscillator/Momentum Tools | Tools like RSI or MACD showing bullish divergence or momentum. | Tools like RSI or MACD indicating bearish divergence or lost momentum. |
Note: While these tools increase the probability of a valid flag pattern play, traders should always use risk management strategies, as no single confirmation guarantees a sure outcome. Combining multiple tools and confluence factors can enhance the accuracy of trade decisions.
Optimal Conditions for Flag Pattern Trading:
Best Timeframe:
For enhanced clarity and reliability, the daily timeframe (1D) is often favored when trading flag patterns. However, the pattern can still be spotted on timeframes ranging from the 1-hour (1H) to the weekly (1W), with higher timeframes generally providing more robust signals.
Trading Session:
The major market sessions, such as the New York or London sessions for Forex or the first few hours after market open for stocks, tend to offer the most volume and volatility, making them ideal for identifying and trading flag patterns.
Approximate Winning Ratio:
While outcomes vary based on numerous factors, a well-executed flag pattern strategy, combined with other confirmation tools, can achieve a winning ratio between 60-70%. However, individual results may differ, and traders should prioritize risk management over pure win rates.
Flag Pattern Trading Strategy with Confluence:
Entry:
Wait for a confirmed breakout/breakdown from the flag pattern. The confirmation can be a candlestick closing outside the flag’s boundary, preferably with increased volume. Additionally, ensure this breakout aligns with other confluence factors like key support/resistance levels, oscillator signals, or trend alignment.
- For a bullish flag, enter a long position after the price breaks and closes above the flag’s upper trendline.
- For a bearish flag, enter a short position once the price breaks and closes below the flag’s lower trendline.
Stop-Loss:
Place the stop-loss slightly within the flag’s boundary to protect against false breakouts.
- In a bullish flag, set the stop-loss just below the lowest point of the flag.
- In a bearish flag, position the stop-loss just above the highest point of the flag.
Take Profit Level:
A common approach is to target a price move equivalent to the flagpole’s length, projected from the breakout/breakdown point.
- For a bullish flag, measure the length of the flagpole and project that distance upward from the breakout point.
- For a bearish flag, measure the flagpole’s length and project that distance downward from the breakdown point.
Conclusion:
The flag pattern is a powerful continuation signal, offering traders defined entry and exit points. By incorporating confluence elements into the trading strategy, traders enhance the pattern’s reliability, maximizing potential profits while minimizing risks. However, as with all trading strategies, consistent risk management and continual learning are pivotal to success.

