Introduction
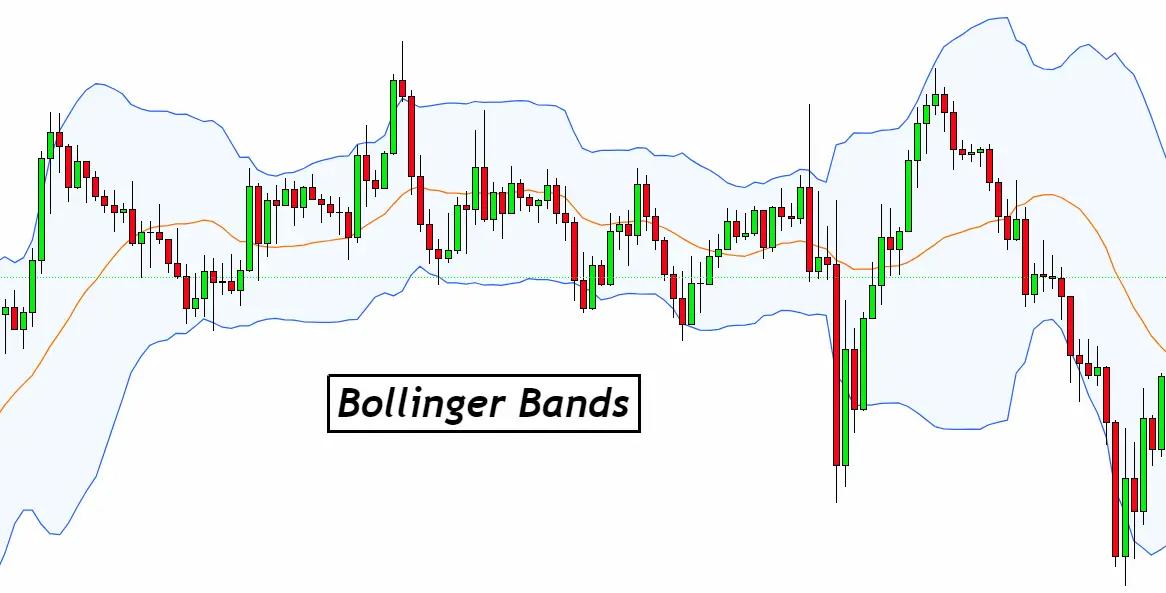
Bollinger Bands are a type of chart indicator. They show price volatility and trends in the Forex market. The Bands have three lines: the Middle, Upper, and Lower Bands.
The Middle Band is a simple moving average. It shows the average price over a certain period.
The Upper and Lower Bands adjust to market changes. They widen with more volatility and narrow when the market is stable.
Traders look at these bands to make decisions. The price touching the Upper Band might mean the market is overbought. Hitting the Lower Band could indicate it’s oversold.
In short, Bollinger Bands helps traders see how prices might move. They use this to buy low and sell high, making profits.
The Significance of Bollinger Bands in Forex Trading
Bollinger Bands are key in Forex trading. They help traders understand market volatility. This insight is crucial for making informed trades.
The significance of Bollinger Bands involves,
- Bollinger Bands are crucial for Forex traders.
- They show market volatility, key for trading decisions.
- Bands highlight overbought or oversold conditions.
- This helps traders decide when to buy or sell.
- They also signal potential trend reversals.
- Spotting these can lead to strategic trades.
- Overall, they provide a clear view of market movements.
- Traders use this for the best entry and exit points.
How Bollinger Bands Work
Step 1: Identifying the Bands
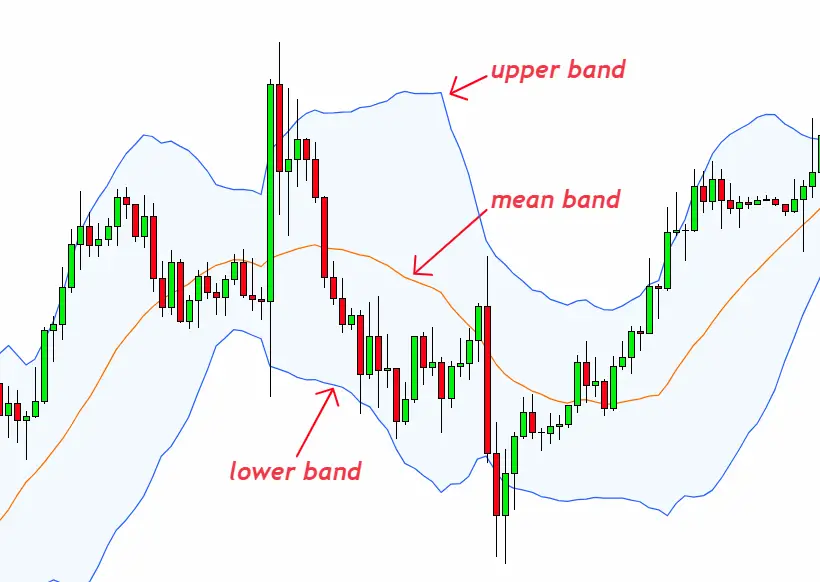
Bollinger Bands consist of three key lines: the Middle, Upper, and Lower Bands. The Middle Band is essentially a simple moving average, showing the average price over a specified period.
Step 2: Observing Band Adjustments
The Upper and Lower Bands adjust in response to market volatility. A widening of these bands signals an increase in volatility, while a narrowing indicates decreased volatility.
Step 3: Interpreting Market Signals
Traders use these bands to predict future price movements. When prices touch the Upper Band, it often suggests that the market is potentially overbought. Conversely, when prices touch the Lower Band, it might indicate an oversold condition.
Step 4: Making Trading Decisions
This insight into market conditions helps traders decide the optimal times to buy or sell. By understanding how Bollinger Bands work, traders can better navigate the Forex market and make informed trading decisions.
Trading Strategies Using Bollinger Bands
Bollinger Bands are versatile tools in Forex trading, offering several strategies to interpret market signals and make informed decisions. Here’s a detailed look at some key trading strategies using Bollinger Bands:
1. Trend Following Strategy
- Basis: This strategy involves identifying the direction of the market trend and trading in alignment with it.
- How it works: When prices consistently touch the Upper Bollinger Band, it may indicate a strong uptrend, suggesting a buying opportunity. Conversely, if prices frequently touch the Lower Band, it might signal a downtrend, indicating a selling opportunity.
- Consideration: It’s crucial to confirm the trend with additional indicators or price patterns to avoid false signals.

2. Bollinger Squeeze
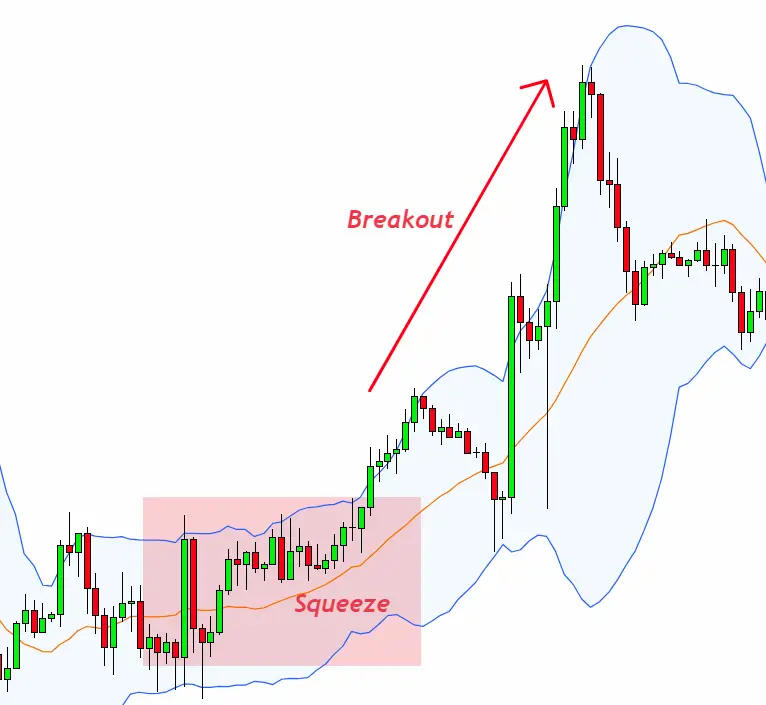
- Basis: The Bollinger Squeeze is based on the principle that a period of low volatility is often followed by high volatility, indicating a potential breakout.
- How it works: When the bands contract and come closer together, it signifies decreased market volatility, suggesting an impending significant price movement. Traders watch for a breakout above or below the bands to enter trades in the direction of the breakout.
- Consideration: It’s important to wait for a confirmed breakout with high volume to reduce the risk of false signals.
3. Reversal Strategy (Mean Reversion)
- Basis: This strategy assumes that prices tend to revert back to the mean or average level over time.
- How it works: Traders look for instances where the price has moved significantly away from the Middle Band and expect it to move back towards the mean. For example, buying opportunities may arise when the price hits the Lower Band and starts to revert back towards the Middle Band.
- Consideration: This strategy works best in ranging or sideways markets and should be used cautiously in strong trending markets.
4. Double Bollinger Band Strategy
- Basis: This strategy uses two sets of Bollinger Bands to gauge the strength of a trend and potential entry or exit points.
- How it works: One set of bands is set with a standard deviation higher than the other. The area between the two bands can act as a zone to indicate the strength of the trend. For instance, in an uptrend, prices staying between the upper bands of both sets might indicate a strong trend.
- Consideration: This strategy requires careful monitoring and a good understanding of market conditions to interpret the signals correctly.
5. Combining with Other Indicators
- Basis: Bollinger Bands can be effectively combined with other technical indicators like the Relative Strength Index (RSI), Moving Average Convergence Divergence (MACD), or Stochastic Oscillator for more reliable signals.
- How it works: For instance, an overbought signal from RSI or a bearish crossover in MACD, combined with the price touching the Upper Bollinger Band, can provide a stronger signal for a potential sell.
- Consideration: Combining indicators should be done with an understanding of how they complement each other to avoid analysis paralysis from conflicting signals.
Trading strategies using Bollinger Bands offer diverse approaches to analyzing market trends and making decisions. Whether following trends, anticipating breakouts, or identifying potential reversals, Bollinger Bands provide valuable insights into market dynamics. However, as with any trading strategy, it’s essential to practice risk management, consider multiple indicators, and gain experience through practice and market observation to refine these strategies for individual trading styles and market conditions.
Practical Examples of Bollinger Bands in Forex Trading
Incorporating practical examples can help illustrate how Bollinger Bands are used in Forex trading. Here are a few scenarios:
Example 1: Trend Identification
- Situation: The EUR/USD pair starts showing an uptrend on the daily chart.
- Bollinger Bands Behavior: The price is consistently hitting and occasionally breaching the Upper Bollinger Band.
- Action Taken: Traders might view this as a strong uptrend signal and consider taking long positions.
- Outcome: If the trend continues, staying above the Middle Band and frequently touching the Upper Band, it could lead to profitable long trades.
Example 2: Bollinger Squeeze and Breakout
- Situation: On the GBP/JPY pair, the market begins to consolidate, and volatility decreases.
- Bollinger Bands Behavior: The Bollinger Bands contract significantly, indicating a “squeeze.”
- Action Taken: Traders anticipate a potential breakout and closely monitor the direction of the price breakout from the squeeze.
- Outcome: A sharp price move above the Upper Band could suggest a bullish breakout, prompting traders to enter long positions, whereas a move below the Lower Band might indicate a bearish breakout, leading to short positions.
Example 3: Mean Reversion Trade
- Situation: The USD/CAD pair is in a ranging market without a clear trend.
- Bollinger Bands Behavior: Prices fluctuate between the Upper and Lower Bands but revert to the Middle Band frequently.
- Action Taken: Traders might use this pattern for mean reversion trades, buying near the Lower Band with an expectation that the price will move back towards the Middle Band, and selling near the Upper Band with the same logic in reverse.
- Outcome: In a ranging market, this strategy can yield profits from the price bouncing back and forth between the bands.
Example 4: Combining with RSI
- Situation: The AUD/USD pair shows the price touching the Lower Bollinger Band.
- Bollinger Bands Behavior: The price is near the Lower Band, suggesting potential oversold conditions.
- RSI Indicator: The Relative Strength Index (RSI) also indicates an oversold condition (below 30).
- Action Taken: The confluence of oversold signals from both Bollinger Bands and RSI might lead traders to consider taking a long position, anticipating a price rebound.
- Outcome: If the market responds to these oversold conditions, the price may recover, allowing traders to capitalize on the upward movement.
Example 5: Double Bollinger Band Strategy
- Situation: Traders are analyzing the NZD/USD pair for trend strength.
- Bollinger Bands Behavior: Two sets of Bollinger Bands are applied; one set with a standard deviation of 1 and another with a standard deviation of 2.
- Action Taken: Traders observe that the price is consistently between the upper bands of both sets, indicating a strong uptrend.
- Outcome: Recognizing the trend’s strength, traders might take or hold long positions until there are clear signs of trend weakening, such as the price falling into the lower bands.
These examples demonstrate how Bollinger Bands can be applied in various market conditions to make informed trading decisions. Each scenario highlights the importance of context, additional indicators, and risk management in successful Forex trading strategies.
Tips for Maximizing Success with Bollinger Bands
To maximize success when using Bollinger Bands in Forex trading, consider these tips:
1. Understand Market Context
- Tip: Always analyze Bollinger Bands within the broader market context.
- Why It Matters: Bollinger Bands can give different signals in trending markets versus ranging markets. Understanding the current market environment is crucial for interpreting these signals correctly.
2. Use Additional Indicators
- Tip: Combine Bollinger Bands with other indicators for confirmation.
- Why It Matters: Using indicators like RSI, MACD, or Stochastic Oscillators alongside Bollinger Bands can provide more reliable signals and reduce false positives.
3. Be Cautious of False Breakouts
- Tip: Watch out for false breakouts, especially after a Bollinger Band Squeeze.
- Why It Matters: Not all breakouts lead to new trends. Confirm breakouts with additional indicators or increased volume to validate the move.
4. Adjust Settings to Suit Your Strategy
- Tip: Customize the settings of Bollinger Bands to match your trading style.
- Why It Matters: The default setting might not suit all trading strategies. Adjusting the period and standard deviation can make the bands more responsive or smoother.
5. Practice Risk Management
- Tip: Always incorporate risk management techniques.
- Why It Matters: No indicator, including Bollinger Bands, provides foolproof signals. Implement stop-loss orders and manage your trade size to protect your capital.
6. Look for Band Contraction
- Tip: Pay attention to periods when the bands contract, as they often precede significant market moves.
- Why It Matters: Band contraction suggests a decrease in volatility and can lead to explosive moves, offering potential trading opportunities.
7. Be Aware of Psychological Levels
- Tip: Consider psychological price levels alongside Bollinger Bands.
- Why It Matters: Round numbers or historical highs and lows can influence market behavior and should be factored into your analysis.
8. Gain Experience with Backtesting
- Tip: Practice and backtest strategies using Bollinger Bands on historical data.
- Why It Matters: Backtesting helps you understand how these bands would have performed in different market conditions, building your confidence in using them.
9. Keep Learning and Stay Updated
- Tip: Continuously educate yourself and stay updated on market news.
- Why It Matters: Market conditions change, and staying informed helps you adjust your strategies accordingly.
By following these tips, traders can enhance their ability to use Bollinger Bands effectively, leading to more informed and potentially successful trading decisions in the Forex market.
Advanced Techniques and Considerations
For traders looking to deepen their expertise with Bollinger Bands, advanced techniques and considerations can provide nuanced insights into market dynamics and enhance trading strategies:
1. Multiple Time Frame Analysis
- Technique: Use Bollinger Bands across different time frames to gain a comprehensive view of the market.
- Consideration: Aligning signals from multiple time frames can increase the reliability of trading signals, with longer time frames providing the trend context and shorter time frames offering entry and exit points.
2. Bollinger Band Width Indicator
- Technique: Monitor the Bollinger Band Width, which measures the distance between the Upper and Lower Bands.
- Consideration: Significant changes in band width can signal shifts in volatility. Narrowing bands suggest low volatility and potential breakouts, while widening bands indicate increased volatility and strong trends.
3. Bollinger %B Indicator
- Technique: Utilize the %B indicator, which shows the price’s position relative to the bands.
- Consideration: A %B value above 1 or below 0 can indicate extreme conditions, potentially signaling reversals or continuations, depending on the context and other confirmatory signals.
4. Bollinger Band ‘M’ and ‘W’ Patterns
- Technique: Look for ‘M’ (double top) and ‘W’ (double bottom) patterns formed by price action relative to the bands.
- Consideration: These patterns can signal potential trend reversals. An ‘M’ pattern with the second peak breaching the Upper Band might indicate a bearish reversal, while a ‘W’ pattern with the second trough breaching the Lower Band could signal a bullish reversal.
5. Volatility Breakout Systems
- Technique: Develop systems that trigger trades based on volatility breakouts signaled by the bands.
- Consideration: Such systems can be highly effective in markets that exhibit strong trends following periods of consolidation, but false breakouts can pose risks, necessitating strict risk management rules.
6. Integrating Price Action
- Technique: Combine Bollinger Bands with classic price action patterns (like triangles, flags, and head and shoulders) for entry and exit signals.
- Consideration: Price action patterns can provide additional confirmation for trades suggested by Bollinger Bands, enhancing the trade’s probability of success.
7. Adaptive Bollinger Bands
- Technique: Adjust the Bollinger Band settings dynamically based on market conditions or volatility.
- Consideration: Adaptive settings can make the bands more responsive during high volatility periods and more stable during low volatility periods, but require careful tuning to avoid overfitting.
8. Pairing with Elliott Wave Theory
- Technique: Use Bollinger Bands in conjunction with Elliott Wave Theory to identify potential starts and ends of wave patterns.
- Consideration: This approach can offer precise entry and exit points within the context of broader wave patterns, but demands a deep understanding of both Elliott Wave Theory and Bollinger Bands.
Advanced techniques with Bollinger Bands involve a deeper understanding of market psychology, volatility, and technical analysis principles. While these methods can enhance trading strategies, they also require thorough testing and a solid grasp of underlying market mechanisms. As always, combining these advanced techniques with robust risk management practices is essential to navigating Forex markets successfully.
Conclusion
In conclusion, Bollinger Bands are a powerful tool in the arsenal of Forex traders, offering a versatile approach to understanding market volatility, trends, and potential price reversals. From basic strategies that capitalize on trends and volatility to advanced techniques that integrate with other indicators and market analysis frameworks, Bollinger Bands provide a depth of insight into market dynamics.
The key to maximizing the effectiveness of Bollinger Bands lies in understanding the market context, combining them with other technical analysis tools for confirmation, and continuously refining strategies through backtesting and market observation. Advanced techniques, such as multiple time frame analysis and the integration of price action patterns, can further enhance trading decisions, making Bollinger Bands a flexible and adaptable tool for traders at all levels.
However, it’s crucial to remember that no trading strategy is infallible. Successful trading with Bollinger Bands, like any other technical analysis tool, requires a solid foundation in risk management, an understanding of market psychology, and a commitment to ongoing learning and adaptation to market changes. With these principles in mind, traders can leverage Bollinger Bands to navigate the complexities of the Forex market and work towards achieving their trading goals.

