Definition:
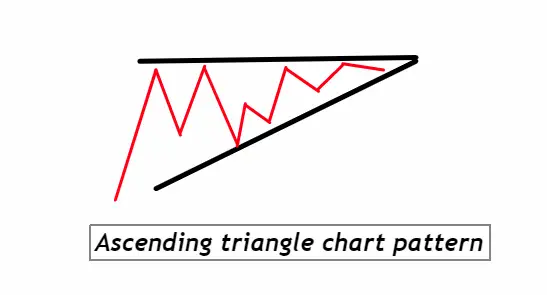
An ascending triangle is a bullish chart pattern characterized by a flat top and an upward-sloping bottom trendline. The ascending triangle signals potential upward breakout as price consolidation narrows within the pattern, indicating a potential continuation or reversal in the prevailing trend.
How to Identify an Ascending Triangle Chart Pattern:
- Established Trend: Start by looking for a prior trend, typically bullish. The ascending triangle can act as a continuation pattern within this trend.
- Flat Top: Identify a horizontal resistance line where the asset’s price has hit multiple times without breaking through.
- Upward Sloping Bottom: Spot a series of higher lows. These should form an upward-sloping trendline converging with the horizontal resistance.
- Volume: Notice declining volume as the pattern progresses, with a potential volume spike when the breakout occurs.
- Duration: The pattern can form over various timeframes, from several weeks to months. However, the longer the pattern, the more significant the breakout (or breakdown) is likely to be.
- Breakout Confirmation: For validation, watch for a breakout above the horizontal resistance with increased volume, signaling the start of a new bullish trend or the continuation of the existing trend.
By keeping these points in mind, traders can efficiently identify the ascending triangle pattern and potentially forecast the future price direction.
Significance of the Ascending Triangle Pattern:
- Forecasting Tool: One of the primary utilities of the ascending triangle pattern is its role as a forecasting tool. Given its clear boundaries and defined breakout point, traders can set expectations about potential price movement. When the breakout occurs, especially with significant volume, it reinforces the prediction and offers traders actionable insights.
- Risk Management: The ascending triangle provides well-defined support and resistance levels. This clear demarcation assists traders in setting stop-loss points just below the upward-sloping trendline, thus managing their risks efficiently. If the pattern breaks down instead of breaking out, traders have a predetermined exit strategy, limiting potential losses.
- Strength Indication: The very formation of higher lows in this pattern signifies buying pressure. Every time the asset pulls back, it doesn’t go as low as the previous low, indicating that buyers are stepping in earlier and could eventually overwhelm the sellers at the resistance level. This insight can be invaluable for traders in assessing the market’s mood and the strength of the underlying trend.
- Versatility: While typically seen as a bullish pattern, the ascending triangle’s versatility shouldn’t be underestimated. If the pattern breaks to the downside, it can be a strong bearish signal. Thus, while the pattern leans bullish, a savvy trader remains open to all potential outcomes, ensuring they’re prepared for any market direction.
In essence, the ascending triangle is a trader’s guidepost. It not only forecasts potential price direction but also helps streamline decision-making processes, allowing for effective risk management and more informed trading strategies.
Activity of Big Traders During the Formation of an Ascending Triangle:
- Accumulation Phase: The ascending triangle often indicates an accumulation phase, especially by institutional or “big” traders. As the price makes higher lows, it’s suggestive of these large entities buying on dips, gradually accumulating a position without driving the price too aggressively higher. This systematic buying creates the upward-sloping support line.
- Resistance Level: The horizontal top of the triangle, which acts as resistance, is where selling pressure is evident. It’s likely that at this level, either a portion of institutional traders are taking profits or other market participants believe the asset is overvalued. Each time the price approaches this level and retraces, it’s an indication that there’s still a significant amount of supply or selling interest at that price point.
- Tug of War: The narrowing price range (between the upward sloping support and flat resistance) can be visualized as a tug of war between buyers (bulls) and sellers (bears). As the pattern matures, one side is expected to give in. When big traders decide to break the resistance by buying en masse, this often results in the breakout of the ascending triangle, especially if their buying volume overwhelms the existing selling pressure at the resistance.
- Breakout Strategy: Institutional traders often set buy orders just above the resistance level of the triangle, capitalizing on the anticipated breakout. This strategy is based on the expectation that once resistance is breached, a rush of buying activity (from both institutional and retail traders) will follow, propelling the price higher. The initial breakout might be further accentuated by the covering of short positions, adding to the buying pressure.
For retail traders, understanding the activities of larger players during the formation of patterns like the ascending triangle is essential. Recognizing the signs of accumulation and the strategies employed by these big traders can provide valuable context, allowing retail traders to position themselves advantageously and ride the wave initiated by larger market forces.
Ascending Triangle Confirmation Tools for High Probability Trades
| Tool/Indicator | Description |
|---|---|
| Key Resistance Level | Ensure a clear horizontal resistance where price touches multiple times without breaking through. |
| Break of Higher Low | After pattern formation, a bullish sign would be if prices don’t drop below the most recent higher low. Conversely, a break below this might suggest weakening of the bullish case. |
| Volume Surge | Monitor for an increase in volume during the breakout. A significant volume spike confirms the legitimacy of the breakout and indicates strong participation in the move. |
| Complementary Technical Indicators | Use indicators like the Relative Strength Index (RSI) or Moving Average Convergence Divergence (MACD). For instance, RSI moving above 70 might confirm bullish momentum, while MACD crossovers can reinforce the trend direction indicated by the triangle breakout. |
Traders can leverage this confirmation table alongside the ascending triangle pattern to increase their trade’s probability of success and make more informed decisions in the market.
Ascending Triangle Trading Strategy with Confluence
- Confluence Factors: Before making an entry, look for multiple confirmatory signals to ensure a higher probability trade. This can be in the form of:
- Trend Direction: Align your trade with the broader trend. If the market is in an uptrend and an ascending triangle forms, it strengthens the bullish case.
- Key Support/Resistance Levels: Historical price levels where price has shown a reaction can act as further confirmation.
- Technical Indicators: A bullish MACD crossover or an RSI moving above a key threshold (e.g., 70) can provide additional confirmation.
- Entry Point: Once the above confluence factors align, the optimal entry point would be upon a confirmed breakout above the triangle’s resistance. A more conservative approach would be to wait for a retest of the broken resistance, which may then act as support, and then enter on the bounce.
- Stop Loss: Place the stop loss just below the last established higher low within the triangle. This ensures that you’re protected if the breakout was a false one and price reverts back into the triangle or breaks downward.
- Take Profit Level: Measure the base of the triangle (the vertical distance between the first high and the corresponding low) and project that distance from the breakout point. This gives a potential price target. However, it’s also wise to monitor other resistance levels or technical indicators to fine-tune your exit strategy.
Conclusion:
The ascending triangle, with its clear boundaries and predictable behavior, is a favorite among traders. By adding layers of confluence, traders can enhance the reliability of the pattern, ensuring that they’re not relying solely on the pattern but also incorporating other market dynamics. This holistic approach, combined with a disciplined entry, stop loss, and take profit strategy, can provide traders with a robust framework for navigating the markets.

