Definition
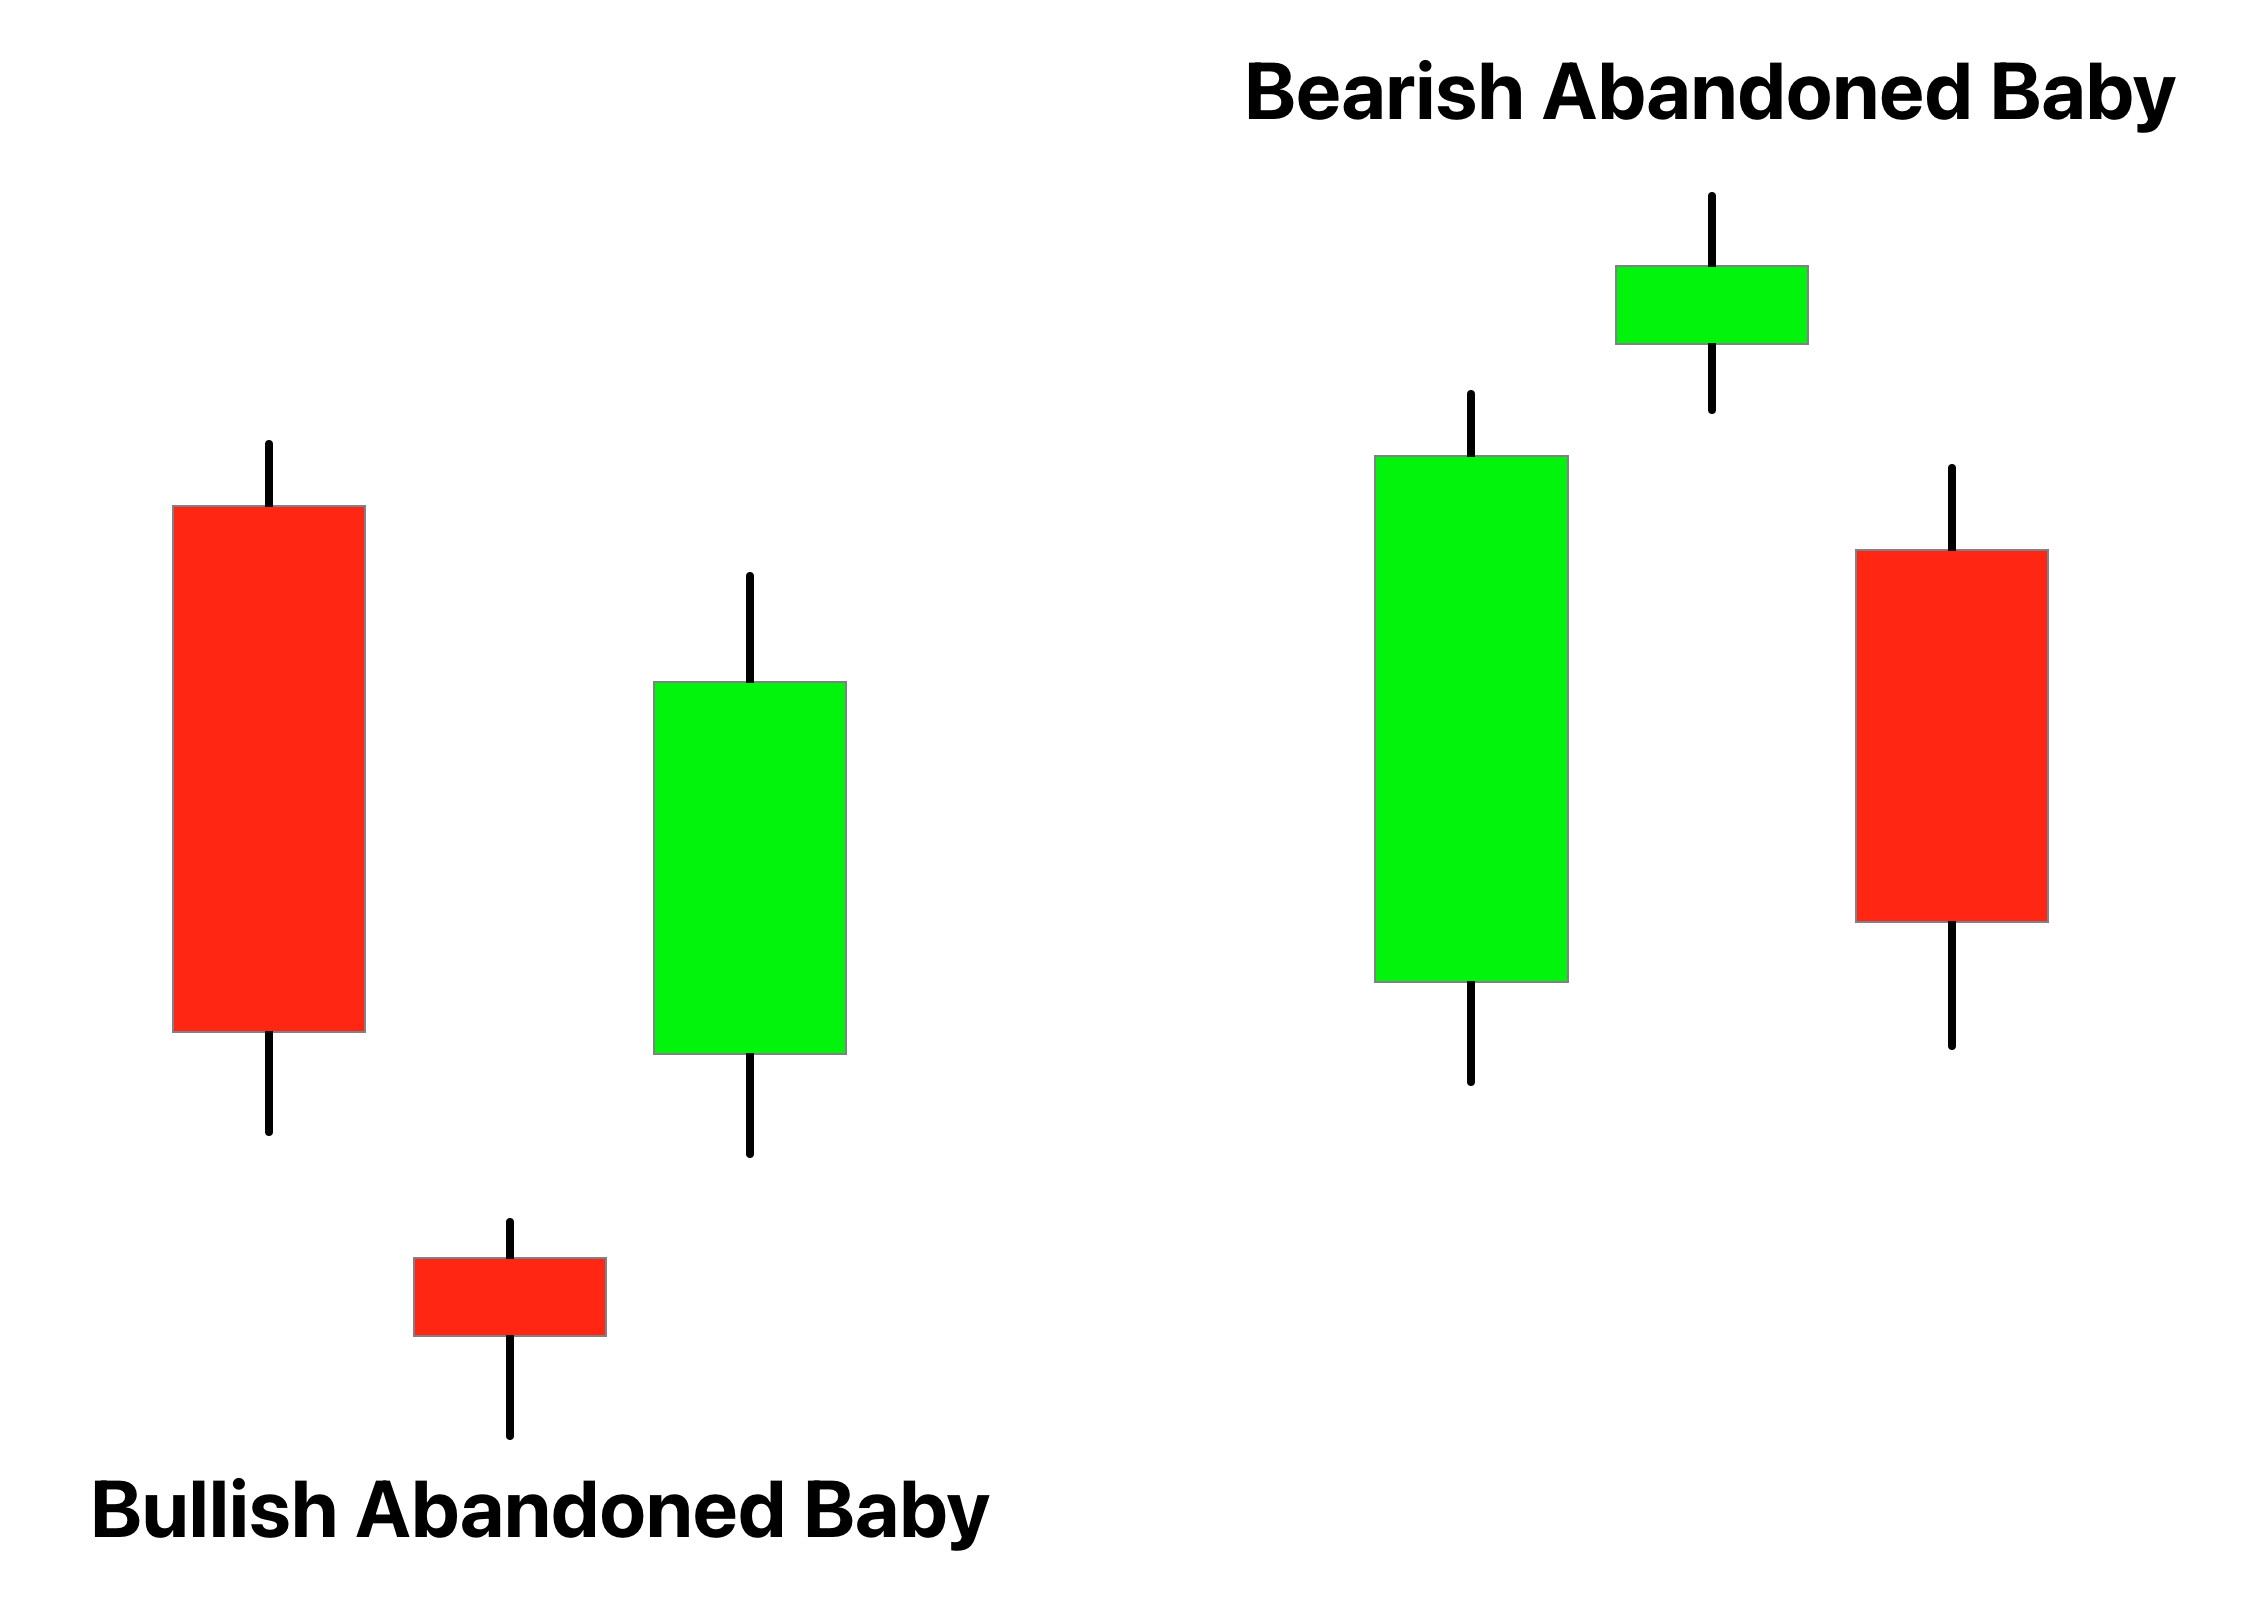
The Abandoned Baby pattern is a three-candlestick pattern, consisting of a large-bodied candle, a Doji that gaps away from the first candle, and a third large-bodied candle that gaps in the opposite direction from the Doji, indicating a potential price reversal.
As a rare but highly reliable pattern, it serves as a strong signal for traders, often pointing to a critical turning point in the market sentiment.
How to find the abandoned baby candlestick pattern?
To identify the Abandoned Baby pattern on a chart, follow these key steps:
- Preceding Trend: Start by identifying a significant bullish or bearish trend. The pattern could signal a reversal to either of these trends.
- Three-Candle Formation: The Abandoned Baby is a three-candlestick pattern. The first candle is a large-bodied candle following the direction of the preceding trend. The second is a Doji, a candlestick where opening and closing prices are virtually equal, that gaps away from the first candle. The third candle is a large-bodied candle that gaps in the opposite direction from the Doji.
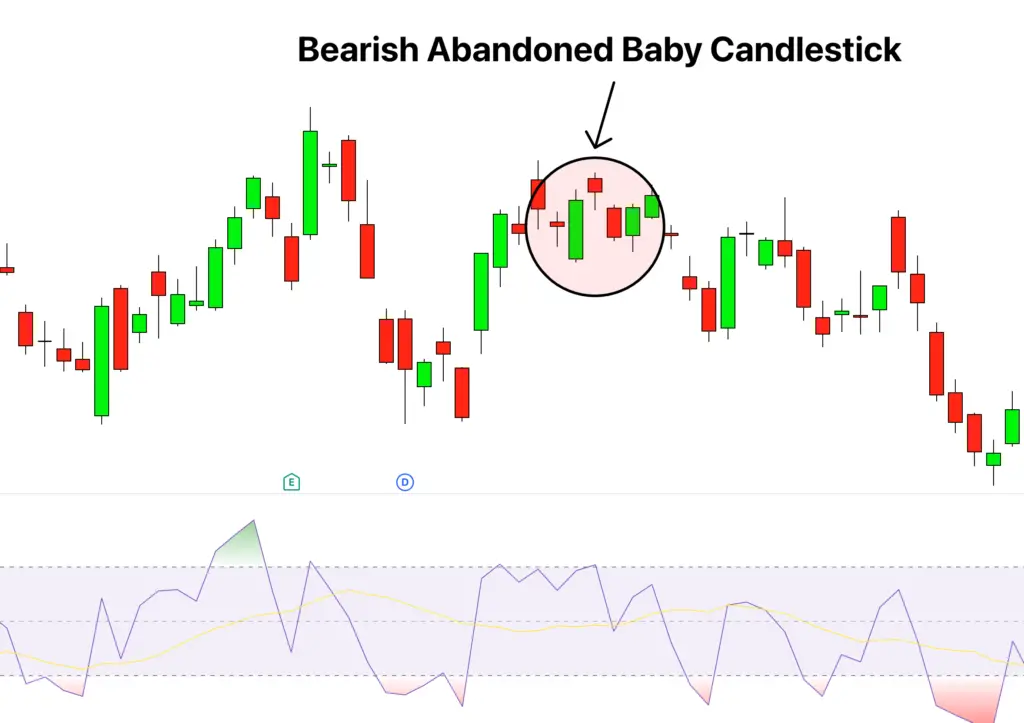
- Gaps: Look for a gap between the first candle and the Doji, and another gap between the Doji and the third candle. In a bullish reversal, the Doji is lower than the first and third candles (known as an Abandoned Baby Bottom). In a bearish reversal, the Doji is higher (known as an Abandoned Baby Top).
- Third Candle Confirmation: The third candle moves in the opposite direction of the prevailing trend, indicating the start of a reversal.
Significance
The Abandoned Baby pattern is a highly reliable indicator in technical analysis, particularly due to its rare occurrence and the strong signals it provides. Here’s what it typically signifies:
- Reversal Signal: The main significance of the Abandoned Baby pattern lies in its ability to indicate potential price reversals. If it forms during a downtrend (Abandoned Baby Bottom), it signals a bullish reversal. Conversely, if it forms during an uptrend (Abandoned Baby Top), it suggests a bearish reversal.
- Shift in Market Sentiment: The pattern signifies a strong shift in market sentiment. After the trend-following first candle, the gapped Doji indicates uncertainty and potential change in direction. The third candle, gapping away from the Doji in the opposite direction of the preceding trend, confirms the sentiment shift.
- High Reliability: Given its rarity, the Abandoned Baby pattern is considered highly reliable in forecasting reversals when it occurs.
- Trading Opportunities: For traders, the appearance of this pattern can create opportunities for timely entries or exits. For instance, an Abandoned Baby Top may suggest a good time to exit long positions or enter short ones, and vice versa for an Abandoned Baby Bottom.
Like all candlestick patterns, the Abandoned Baby should be used alongside other technical tools for trade confirmation.
Activity of traders during formation of abandoned baby pattern
When the Abandoned Baby pattern forms, it often indicates a noteworthy shift in the activities of large market players, including institutional investors and big traders. Here’s a breakdown of what might be happening:
- Changing Positions: During the formation of the Abandoned Baby, larger market participants may be in the process of shifting their positions in anticipation of a market reversal. For instance, if an Abandoned Baby Top forms after an uptrend, big traders may be closing their long positions or opening short ones, anticipating a bearish reversal.
- Absence of Continuation: The gaps between the candles signify an absence of traders willing to continue the preceding trend. The first gap, between the first candle and the Doji, suggests the initial slowdown of the prior trend. The second gap, between the Doji and the third candle, confirms this sentiment, as the price moves in the opposite direction.
- Volume Confirmation: If there’s a surge in volume during the formation of the third candle, it can suggest that large traders are actively participating in the emerging reversal. This increased volume can provide further validation for the pattern.
- Market Manipulation: As always, retail traders should be wary of potential market manipulation. Sometimes, large traders might induce patterns to trap retail traders. Hence, it’s crucial to use additional indicators and tools for confirmation before making a trading decision.
Confirmation tools for high probability abandoned baby pattern
When trading the Abandoned Baby pattern, using additional confirmation tools can enhance the reliability of the pattern. Here are four such tools:
- Key Levels: Look for the pattern around key price levels such as support and resistance. If the pattern forms at these levels, it can provide a stronger indication of a potential reversal.
- High Volume: Keep an eye on trading volume. A spike in volume on the third candle can indicate strong participation from traders, adding weight to the reversal signal.
- Technical Indicators: Use indicators like the Relative Strength Index (RSI) or Moving Average Convergence Divergence (MACD) to confirm divergence or oversold/overbought conditions that align with the reversal signaled by the Abandoned Baby.
- Break of High/Low: A break of the high (in case of Abandoned Baby Bottom) or low (in case of Abandoned Baby Top) by subsequent candles can provide further confirmation of the pattern.
| Confirmation Tool | Application |
|---|---|
| Key Levels | Look for the pattern around support/resistance levels |
| High Volume | Check for a volume spike on the third candle |
| Technical Indicators | Confirm the pattern using indicators like RSI or MACD |
| Break of High/Low After Pattern Formation | Watch for breaks of the high/low by subsequent candles |
Key points
- Best Timeframe: The Abandoned Baby pattern can technically form on any timeframe. However, it tends to be more reliable on higher timeframes such as the daily, weekly, or monthly charts. Patterns on these timeframes often reflect more substantial shifts in market sentiment.
- Trading Session: This pattern can form in any trading session. However, its reliability may be higher during sessions with higher liquidity, such as the overlap of the London and New York sessions for forex markets, or the regular trading hours for stock markets.
- Winning Ratio: The Abandoned Baby is a high reliability pattern, but it’s also relatively rare. Its winning ratio can vary based on the market and timeframe, among other factors. However, some studies suggest a potential accuracy rate of 70-80% when combined with other confirmation tools.
Trading Strategy
The Abandoned Baby pattern can be used to formulate a trading strategy. Adding confluence, such as technical indicators or key levels, can provide further confirmation and improve the strategy’s reliability. Here’s an example of how to do this:
Bullish Abandoned Baby
- Identify the Pattern and Confluence: First, identify the Abandoned Baby Bottom pattern forming at a key support level. Add a confluence indicator like RSI showing an oversold condition.
- Entry: Enter a long trade at the opening price of the next candle after the pattern is complete. Confirmation of the reversal would be a bullish candle closing above the high of the third candle in the pattern.
- Stop Loss: Set a stop loss slightly below the low of the Doji. This level should be below the support level where the pattern formed.
- Take Profit: Set the take profit level at the next significant resistance level or aim for a risk/reward ratio that aligns with your trading plan, such as 1:2 or 1:3.
Bearish Abandoned Baby
- Identify the Pattern and Confluence: Identify an Abandoned Baby Top pattern forming at a key resistance level. Add confluence, for example, RSI showing an overbought condition.
- Entry: Enter a short trade at the opening price of the next candle after the pattern. Confirmation would be a bearish candle closing below the low of the third candle in the pattern.
- Stop Loss: Set a stop loss slightly above the high of the Doji. This level should be above the resistance level where the pattern formed.
- Take Profit: Set the take profit level at the next significant support level or aim for a risk/reward ratio that aligns with your trading plan.
This is a basic trading strategy using the Abandoned Baby pattern.
Conclusion
In conclusion, the Abandoned Baby pattern is a powerful tool that can provide valuable insights into potential market reversals. While its occurrence may be rare, its reliability, when it does appear, is relatively high.
However, as with all trading patterns, the Abandoned Baby shouldn’t be used in isolation. Additional confirmation tools such as key levels, volume analysis, and technical indicators can significantly improve its effectiveness. And while the pattern can be used on various timeframes, its strength is typically more pronounced on the higher ones.

