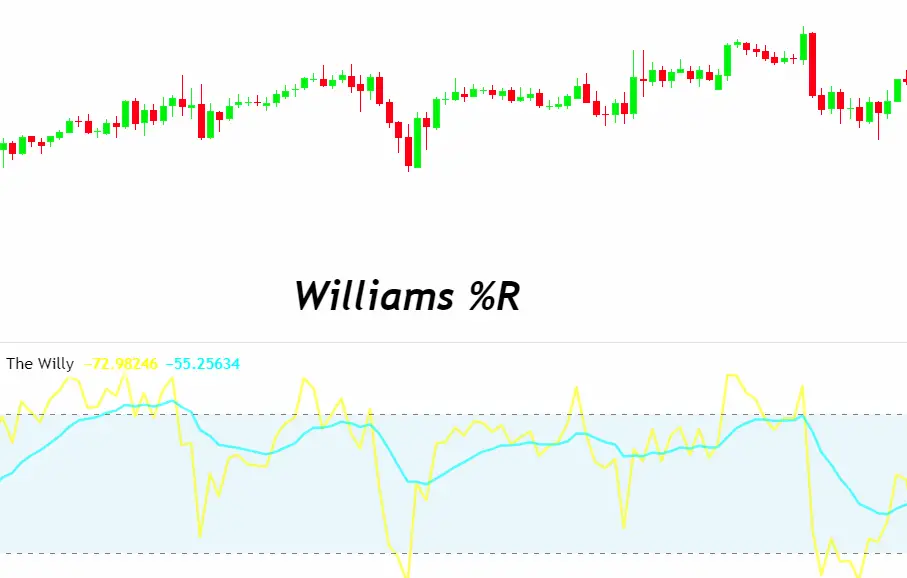
Williams %R, also known as the Williams Percent Range. It is a type of momentum indicator in the field of technical analysis. It isused to identify overbought and oversold conditions in a financial market. Developed by Larry Williams, a renowned trader and author. It measures the level of the closing price relative to the high-low range over a specified period, typically 14 days.
The Williams %R oscillates between 0 and -100, where:
- A reading near the upper end (-0 to -20) indicates that the market might be overbought, suggesting a potential selling opportunity.
- A reading near the lower end (-80 to -100) signals that the market might be oversold, pointing to a potential buying opportunity.
Traders use Williams %R to gauge market momentum and to make decisions on entry and exit points based on the perceived turning points in the market. It is particularly popular in forex trading but applicable to various types of markets, including stocks and commodities.
Key Features
The Williams %R indicator, developed by Larry Williams, is notable for several key features that make it a popular tool among traders:
- Range: The indicator fluctuates between 0 and -100, providing a clear, bounded range that helps identify overbought and oversold conditions.
- Sensitivity: It is highly sensitive to market movements, making it useful for spotting short-term price reversals.
- Overbought and Oversold Levels: Values above -20 typically indicate overbought conditions, suggesting a potential price reversal to the downside. Conversely, values below -80 indicate oversold conditions, hinting at a potential price reversal to the upside.
- Comparison with Other Indicators: Williams %R often gets compared to the Stochastic Oscillator due to its similar function and appearance. However, Williams %R has its unique scaling and interpretation that distinguish it from other momentum indicators.
- Versatility: Traders can apply it across various time frames and markets, including forex, stocks, and commodities, making it a versatile tool for different trading strategies.
- Leading Indicator: Williams %R is considered a leading indicator, meaning it aims to predict future price movements based on momentum, before they actually occur.
These features make Williams %R a valuable tool for traders looking to capitalize on market momentum and identify potential entry and exit points based on overbought and oversold conditions.
How to Use Williams %R in Forex Trading
Using Williams %R in forex trading involves interpreting its values to make informed decisions on buying or selling currency pairs. Here’s how to effectively use this indicator:
Reading the Indicator
- Overbought Territory: When Williams %R falls between 0 and -20, it suggests the market is overbought. This condition implies a potential downward price reversal.
- Oversold Territory: If Williams is between -80 and -100, it indicates the market is oversold, hinting at a potential upward price reversal.
Signal Interpretation
- Buy Signal: A buy signal occurs when the Williams %R value moves out of the oversold territory (-80 to -100) and heads upward, indicating that the selling pressure is easing and a price increase may be imminent.
- Sell Signal: Conversely, a sell signal is given when the Williams %R exits the overbought territory (0 to -20) and moves downward, suggesting that buying pressure is decreasing and a price decrease could follow.
Confirmation with Other Indicators
- To increase the reliability of signals, traders often use Williams %R in conjunction with other indicators like moving averages or MACD. Confirmation from additional indicators helps to filter out false signals and improve trading decisions.
Setting the Period
- The standard period setting for Williams is 14, but traders can adjust this based on their trading strategy and the time frame they are analyzing. Shorter periods make the indicator more sensitive to price changes, while longer periods provide a smoother indicator line.
Risk Management
- It’s crucial to combine the use of Williams with sound risk management strategies. Setting stop-loss orders and taking profit levels can help manage potential losses and lock in gains.
By understanding and applying these principles, forex traders can use the Williams %R indicator to help identify potential turning points in the market, making it a valuable tool for making entry and exit decisions.
Benefits
Using the Williams %R indicator in trading offers several benefits, making it a popular choice among traders for assessing market momentum and identifying potential entry and exit points:
- Market Sentiment Insight: Williams %R helps gauge the market’s current sentiment by identifying overbought and oversold conditions, providing traders with insights into potential market reversals.
- High Sensitivity: Its high sensitivity to price movements allows traders to quickly respond to short-term market fluctuations, making it especially useful for day trading and short-term strategies.
- Simple Interpretation: The straightforward range of 0 to -100 makes the Williams %R easy to interpret, even for beginners, facilitating its integration into various trading strategies.
- Timing Trades: By pinpointing overbought and oversold conditions, Williams %R aids traders in timing their trades more effectively, potentially increasing the chances of entering or exiting trades at more favorable prices.
- Versatility: Suitable for various markets including forex, stocks, and commodities, and adaptable across different time frames, Williams %R is a versatile tool for many trading styles.
- Complementary Tool: It works well in conjunction with other technical analysis tools and indicators, allowing for more comprehensive market analysis and better-informed trading decisions.
- Leading Indicator: As a momentum indicator, Williams %R is considered a leading indicator, potentially offering early signals before market trends change, giving traders a head start in adjusting their positions.
These benefits highlight the utility of this indicator in providing timely and actionable insights, helping traders navigate the complexities of the financial markets with greater confidence.
Strategies for Williams %R
Incorporating it into trading strategies can enhance decision-making and potentially improve trading performance. Here are some common strategies involving Williams %R:
1. Overbought and Oversold Strategy
- Overbought Condition: Sell when Williams %R enters the overbought zone (above -20) and starts to fall, indicating a potential price reversal to the downside.
- Oversold Condition: Buy when it enters the oversold zone (below -80) and begins to rise, suggesting a potential price reversal to the upside.
2. Divergence Trading
- Bullish Divergence: When the price creates lower lows but Williams %R shows higher lows, it indicates underlying strength and a potential bullish reversal.
- Bearish Divergence: If the price makes higher highs while Williams %R indicates lower highs, it suggests underlying weakness and a potential bearish reversal.
3. Trend Confirmation
- Use Williams %R to confirm the strength of a current trend. In a strong uptrend, Williams percentage R should frequently remain above -50. In a downtrend, it should stay below -50, indicating sustained selling pressure.
4. Breakout Strategy
- Monitor Williams percentage R for a breakout from overbought or oversold conditions alongside a price breakout from a consolidation pattern. This can signal the start of a new trend or a strong continuation of the current trend.
5. Failure Swings
- Bullish Failure Swing: Occurs when Williams %R falls into the oversold area, rises above -80, pulls back without reaching -100, and then breaks its prior high. This signals a potential upward move.
- Bearish Failure Swing: Occurs when Williams %R rises into the overbought area, falls below -20, rallies without reaching 0, and then breaks its prior low, signaling a potential downward move.
Integration with Other Indicators
- Combine it with other indicators like moving averages, RSI, or MACD to validate signals and reduce the likelihood of false positives. This multi-indicator approach can provide a more robust trading strategy.
Risk Management
- Regardless of the strategy, incorporate strict risk management rules, including stop-loss orders and position sizing, to protect against significant losses.
These strategies offer various ways to utilize Williams %R in trading, catering to different trading styles and objectives. It’s crucial to backtest and practice these strategies in a simulated environment before applying them to live trading to ensure they align with your trading goals and risk tolerance.
Tips for Optimizing Williams %R Use
To optimize the use of Williams %R in your trading strategy, consider these practical tips:
- Adjust the Period: While the default period for Williams is typically 14, adjusting the period can tailor the indicator’s sensitivity to your trading style. Shorter periods increase sensitivity and are suited for short-term trading, while longer periods provide a smoother indicator line for longer-term analysis.
- Use in Conjunction with Other Indicators: Williams %R should not be used in isolation. Combine it with trend indicators (like moving averages) and volume indicators to confirm signals and reduce the risk of false positives.
- Identify Divergences: Look for divergences between Williams %R and price action. A divergence can be a strong signal for a potential price reversal, offering valuable trading opportunities.
- Apply to Multiple Time Frames: Analyzing this indicator across different time frames can provide a broader perspective on market momentum and potential entry or exit points.
- Pay Attention to Failure Swings: Failure swings within the Williams %R indicator can be powerful signals of market reversals, especially when they occur without a corresponding new high or low in price.
- Watch for Overbought/Oversold Conditions: While overbought or oversold levels can indicate potential reversals, wait for additional confirmation before acting, as markets can remain in these conditions longer than anticipated.
- Set Realistic Profit Targets and Stop-Losses: When entering a trade based on Williams %R signals, set clear profit targets and stop-loss orders to manage risk effectively.
- Backtest Strategies: Before applying any new strategy live, backtest it using historical data to understand how it might have performed in different market conditions.
- Stay Updated on Market News: External factors can influence market conditions significantly. Stay informed about economic events and news that could impact the markets you are trading in.
- Practice Patience and Discipline: Not every signal will lead to a winning trade. Practice patience in waiting for high-quality setups and discipline in sticking to your trading plan.
By incorporating these tips, traders can enhance their use of the Williams %R indicator, potentially leading to more informed and effective trading decisions.
Common Pitfalls to Avoid
When using the Williams %R indicator in trading, it’s important to be aware of common pitfalls that can lead to misinterpretation of signals or poor trading decisions. Here are some key pitfalls to avoid:
1. Overreliance on the Indicator
- Pitfall: Relying solely on Williams %R for trading decisions without considering other market factors or indicators.
- Avoidance: Use Williams %R in conjunction with other technical analysis tools and market analysis to confirm signals.
2. Ignoring Market Context
- Pitfall: Failing to consider the broader market context, such as trends or news events, which can influence price movements.
- Avoidance: Always assess the overall market environment and sentiment before making trading decisions based on Williams signals.
3. Misinterpreting Overbought/Oversold Levels
- Pitfall: Assuming that a currency pair must reverse direction immediately upon reaching overbought or oversold levels.
- Avoidance: Understand that markets can remain overbought or oversold for extended periods. Wait for additional confirmation before trading.
4. Lack of Confirmation
- Pitfall: Acting on Williams signals without confirmation from other indicators or price action, leading to false signals.
- Avoidance: Look for confirmation from price action or other technical indicators before entering or exiting trades.
5. Disregarding Divergences
- Pitfall: Overlooking divergences between Williams %R and price action, which can be significant indicators of potential reversals.
- Avoidance: Pay attention to divergences as they can provide valuable insights into underlying market strength or weakness.
6. Inappropriate Time Frame Usage
- Pitfall: Using Williams on a time frame that doesn’t match your trading strategy, leading to misaligned signals.
- Avoidance: Adjust the Williams %R settings and analysis to the time frame that aligns with your trading strategy.
7. Poor Risk Management
- Pitfall: Failing to implement proper risk management strategies, risking too much on a single trade based on Williams signals.
- Avoidance: Use stop-loss orders and manage position sizes to mitigate risk, ensuring that no single trade significantly impacts your trading capital.
8. Chasing Signals
- Pitfall: Entering trades too late after a signal has been generated, potentially getting in when the move is nearly over.
- Avoidance: Be prompt in your response to signals, but also ensure they are well-confirmed and aligned with your trading plan.
By being mindful of these pitfalls, traders can more effectively utilize the Williams %R indicator.
Conclusion
In conclusion, the Williams %R indicator is a valuable tool, offering insights into market momentum and potential reversal points. Its simplicity and sensitivity make it accessible to traders of all levels, from beginners to experienced professionals. However, like any trading tool, it’s crucial to use Williams %R alongside other indicators and within the context of a comprehensive trading strategy to confirm signals and reduce the risk of false positives.
To optimize the use of Williams %R, traders should adjust the indicator’s settings to match their trading style, use it in conjunction with other technical analysis tools for confirmation, and always consider the broader market context. Paying attention to divergences, failure swings, and maintaining strict risk management practices can further enhance trading decisions.
Avoid common pitfalls such as overreliance on the indicator, ignoring market context, and poor risk management to improve the effectiveness of your trading strategy. Remember, no indicator is infallible, and successful trading requires patience, discipline, and continuous learning.

