Definition
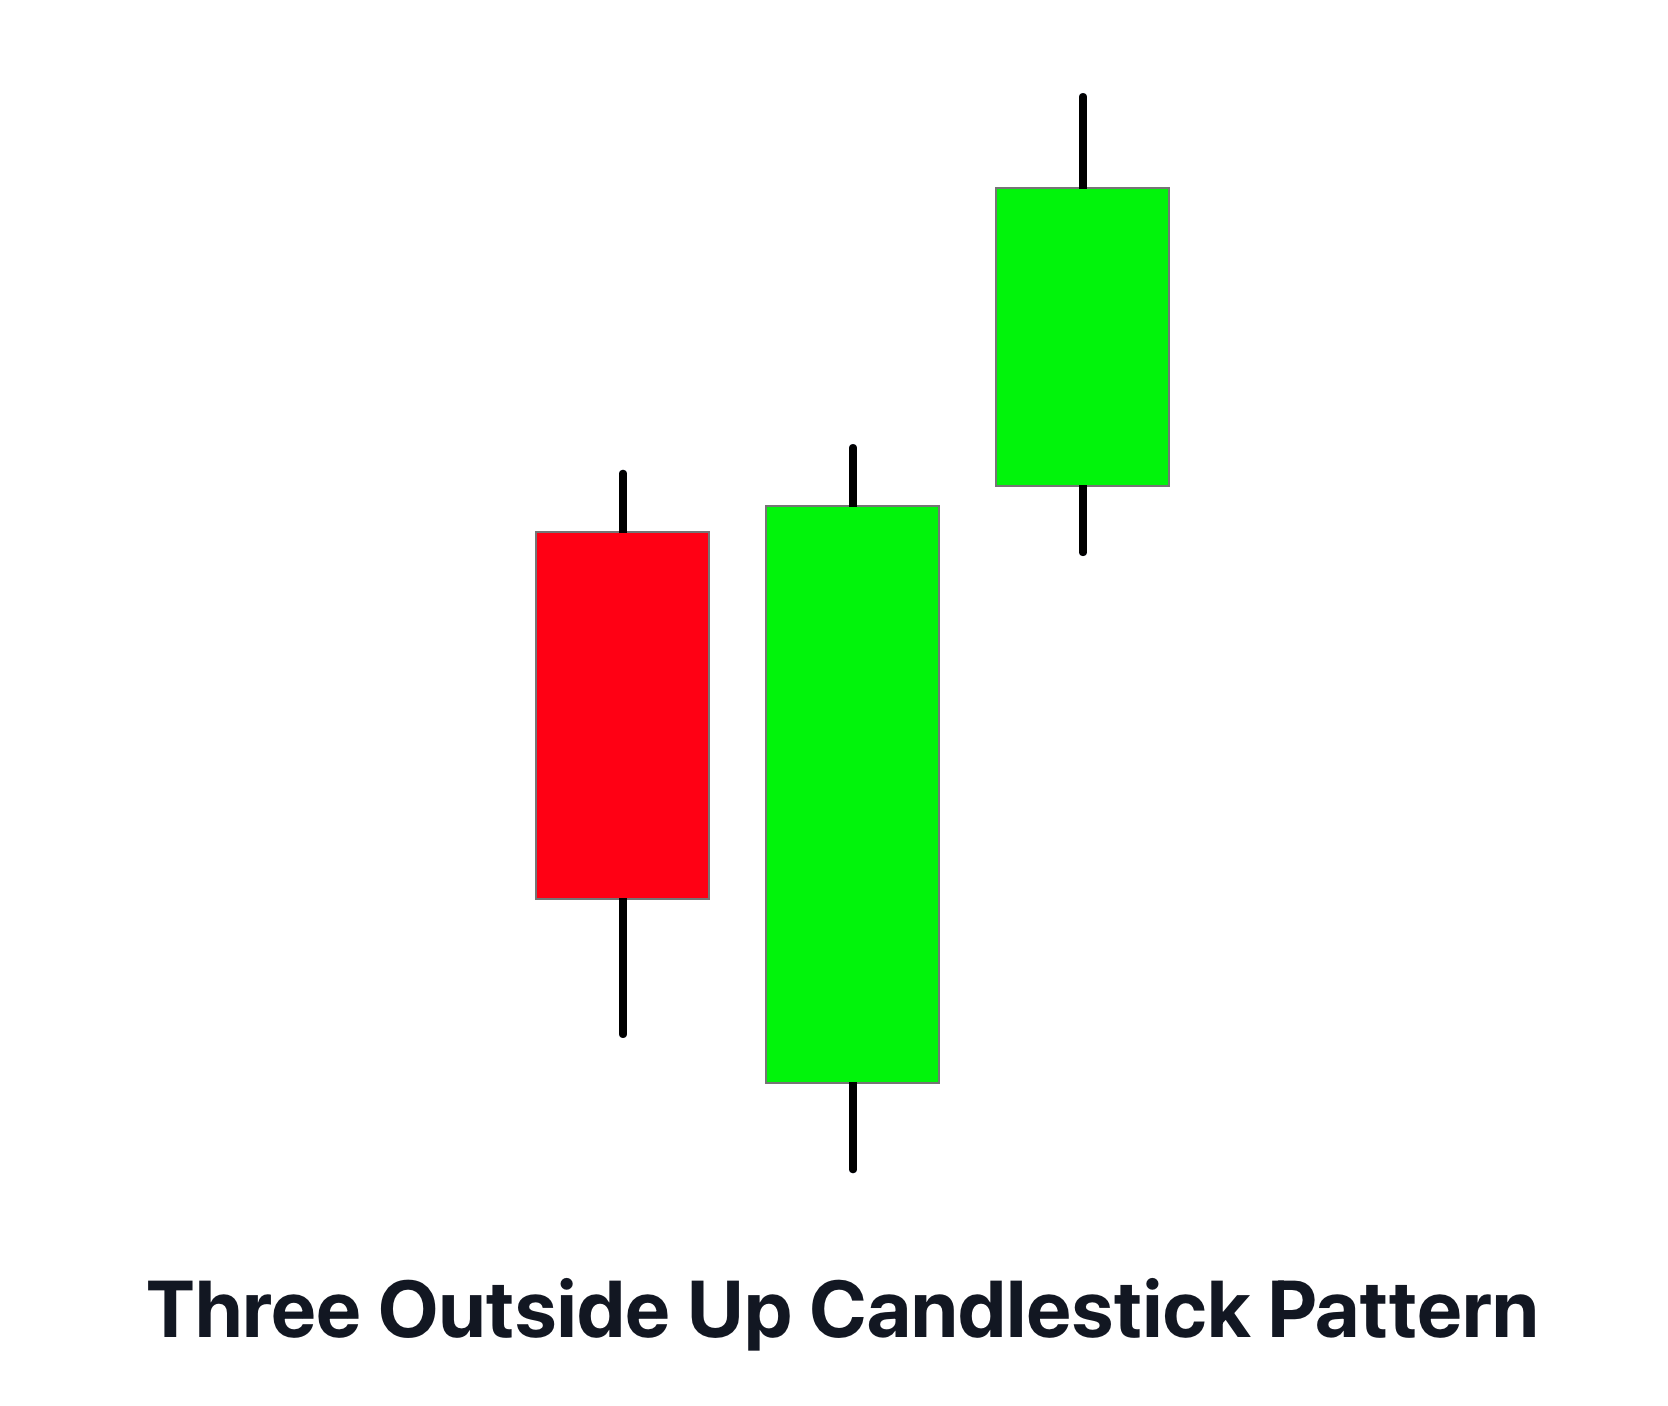
The Three Outside Up candlestick pattern is a bullish reversal pattern that consists of three candles: a bearish candle, a bullish candle that engulfs the first, and a third bullish candle with a higher close than the second.
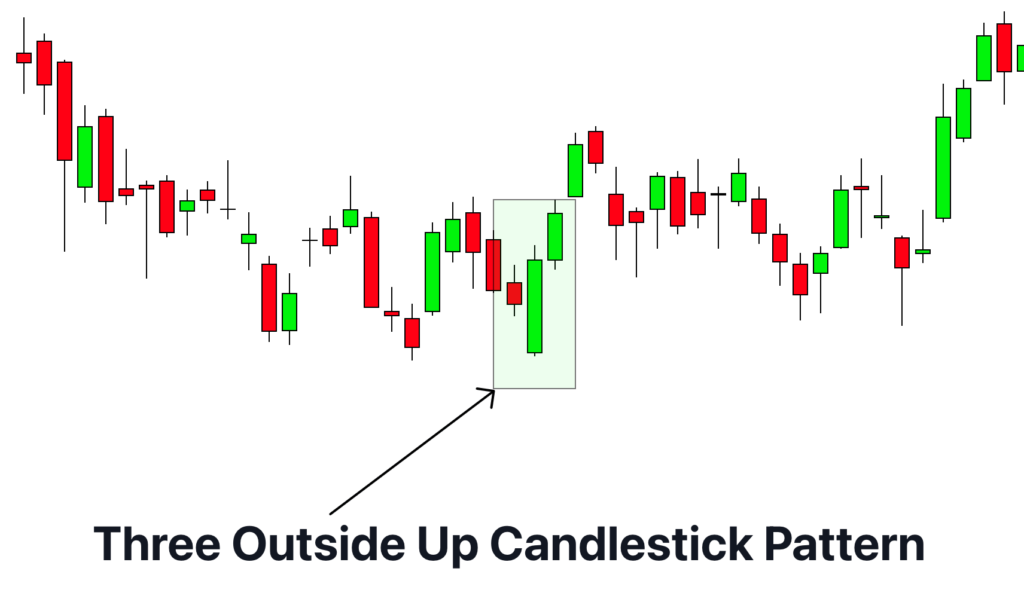
This pattern can be a reliable indicator of an upcoming uptrend. It is typically identified during a downtrend and signals the potential start of a new bullish market phase.
How to identify the Three Outside Up Candlestick Pattern?
Here are the key points to identify the Three Outside Up candlestick pattern on a chart:
- Downtrend Precedence: The pattern should form during a clear downtrend. The bearish sentiment must dominate the market before the pattern occurs.
- First Candle: The first candle of the pattern is a bearish one with a relatively large body. It represents the continuation of the downtrend.
- Second Candle: The second candle is bullish and should engulf the body of the first candle, i.e., it opens lower than the first candle’s close and closes higher than the first candle’s open.
- Third Candle: The third candle is also bullish and its closing price is higher than that of the second candle, confirming the bullish reversal.
Significance
The Three Outside Up candlestick pattern is a significant bullish reversal signal in technical analysis. It indicates a strong shift in market sentiment, transforming from a dominant bearish trend to a new bullish trend.
This pattern suggests that the selling pressure, which was initially significant enough to continue the downtrend (indicated by the first bearish candle), is overcome by a sudden increase in buying pressure. This influx of buyers is strong enough not only to offset the sellers but also to close above the open of the previous day, effectively ‘engulfing’ it (signified by the second bullish candle).
The confirmation comes with the third candle, which is also bullish and closes even higher, confirming the reversal from sellers to buyers’ dominance.
Therefore, when traders spot a Three Outside Up pattern, they often anticipate a bullish market in the upcoming sessions.
Activity of traders during the formation of Three Outside Up Pattern
When a Three Outside Up pattern forms, it is often a reflection of a significant shift in the market sentiment among large traders or institutional investors. The initial bearish candle indicates a continuation of the previous selling pressure led by these big players. However, the second day sees a sudden increase in buying activity, which could signal that big traders have started accumulating the asset, leading to the formation of a bullish engulfing candle.
The third day’s bullish candle serves as confirmation that the buying pressure has indeed taken over. This further suggests that the big traders continue to hold or increase their positions, pushing the price higher. This change in activity from big traders is a crucial signal for retail traders, indicating a potential reversal to a bullish market.
How to find high probability Patterns?
| Confirmation Tool | Description |
|---|---|
| Key Levels | The pattern should occur near significant support levels to increase the validity of the bullish reversal. |
| Volume | An increase in trading volume during the formation of the second and third candles can provide additional confirmation of the pattern. |
| Momentum Indicators | Tools like the Relative Strength Index (RSI) or Stochastic Oscillator can confirm the reversal by showing a shift from oversold to neutral or overbought conditions. |
| Trend Lines or Moving Averages | A break above a downtrend line or a key moving average can provide further evidence of a bullish reversal. |
Key Points to remember
- Best Timeframe: The Three Outside Up pattern can be identified across various timeframes. However, it’s often most significant on daily and weekly charts where each candlestick represents a full day or week of price action, respectively.
- Trading Session: This pattern can form during any trading session, including the New York, London, or Asian sessions. However, patterns formed during sessions with higher volume, such as the New York and London sessions, may carry more weight.
- Winning Ratio: Like other candlestick patterns, the Three Outside Up doesn’t guarantee a win, and its effectiveness depends on the market context, confirmation signals, and risk management. However, with proper context and confirmation, it could provide a winning ratio around 60-65%.
Three Outside Up Trading Strategy
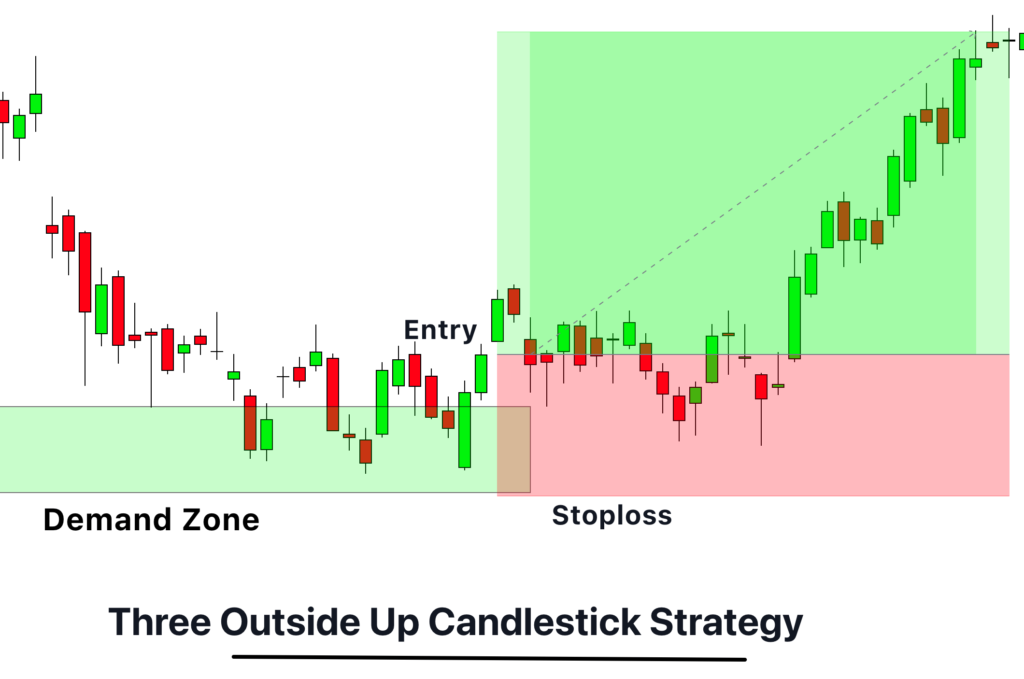
- Entry Point: Look for the Three Outside Up pattern to form at a demand zone, which is a key level where the price has historically increased. This could indicate that the price is about to bounce off this zone and move upwards. Wait for the third candle to close above the high of the first candle, confirming the validity of the pattern.
- Stop Loss: Place the stop loss slightly below the low of the first candle in the pattern. This is a logical place because if the price moves below this level, it invalidates the Three Outside Up pattern, suggesting that the upward momentum may have reversed.
- Take Profit: Target a previous resistance level or use a risk-reward ratio of at least 1:2, meaning for every pip you risk you aim to gain at least two. Adjust this based on the volatility of the market and the length of the candles within the pattern.
Conclusion
The Three Outside Up pattern is a powerful bullish reversal signal, especially when it forms at a demand zone. It suggests a shift in momentum from sellers to buyers. However, like all trading patterns, it should not be used in isolation. Always confirm it with other technical indicators or patterns, and remember to follow sound risk management principles. Trading involves risk and is not suitable for everyone. It’s important to gain a deep understanding of the markets and patterns before trading live.

