Definition
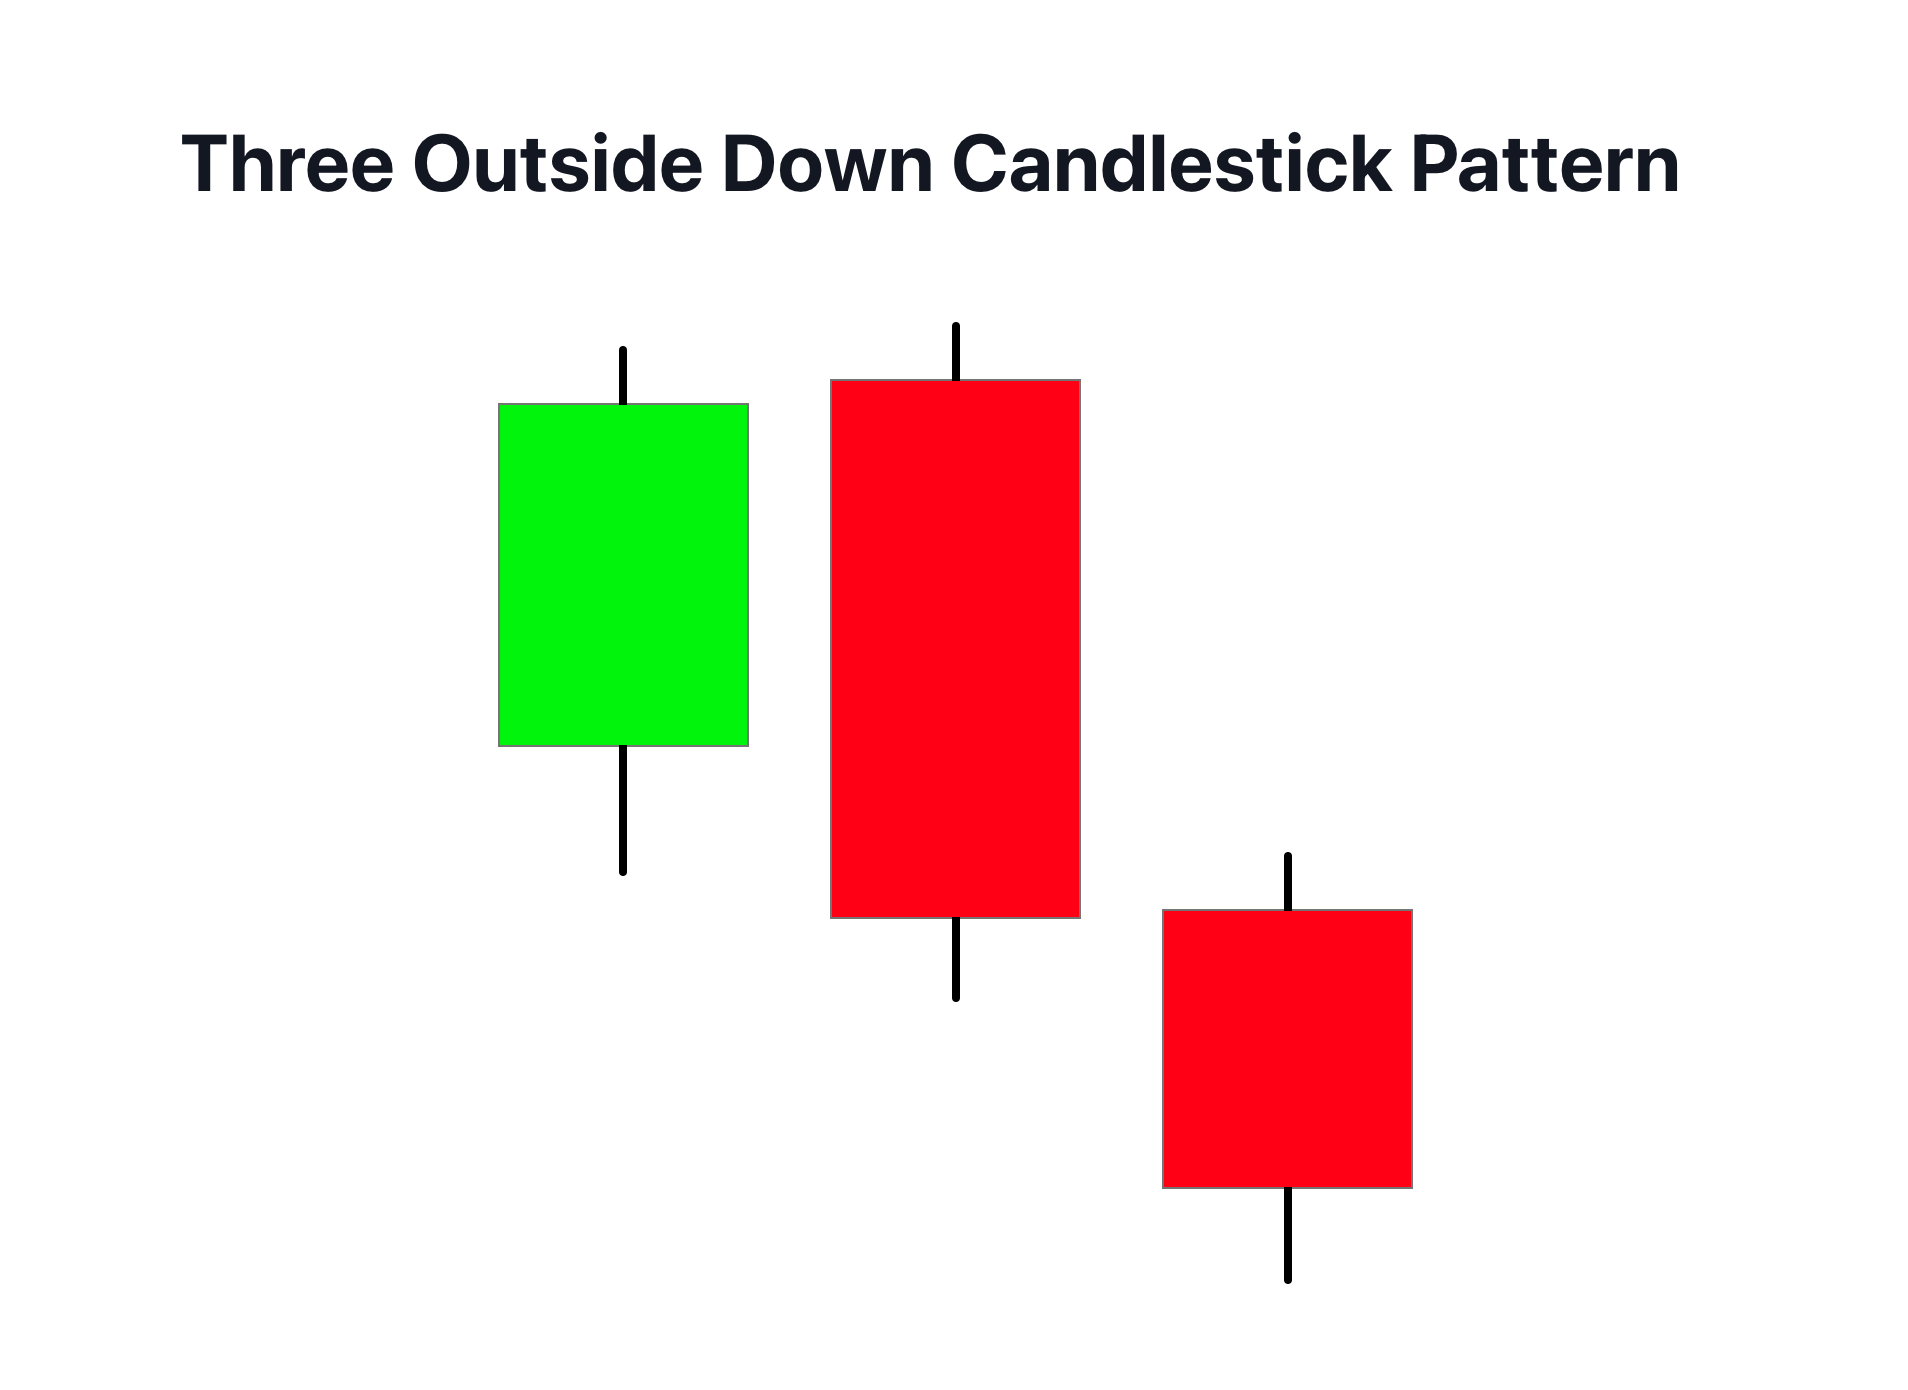
The Three Outside Down is a bearish reversal pattern, consisting of a small bullish candle followed by a larger bearish candle that engulfs the first, then another bearish candle that closes lower than the second one.
This pattern signals the end of an uptrend and the commencement of a potential downtrend. It’s a scenario where the bears overpowered the bulls, making it a key pattern to watch for in bullish markets.
How to identify the Three Outside Down Candlestick pattern?
Identifying the Three Outside Down pattern on the chart involves the following key points:
- Existing Uptrend: The pattern must start with an existing uptrend, where prices have been rising for a significant period.
- Bullish Candle: The first candle in the pattern is a small bullish (green) candlestick that fits entirely within the range of the previous candle.
- Bearish Engulfing: The second candle is a larger bearish (red) one that ‘engulfs’ the body of the first candle, i.e., the open price of the second candle is higher than the close price of the first, and the close price of the second candle is lower than the open price of the first.
- Third Bearish Candle: The third candle is also a bearish one, which closes lower than the close of the second candle, showing continued downward momentum.
- High Volume: Look for increased trading volume on the second and third candle days as this lends credence to the bearish reversal.
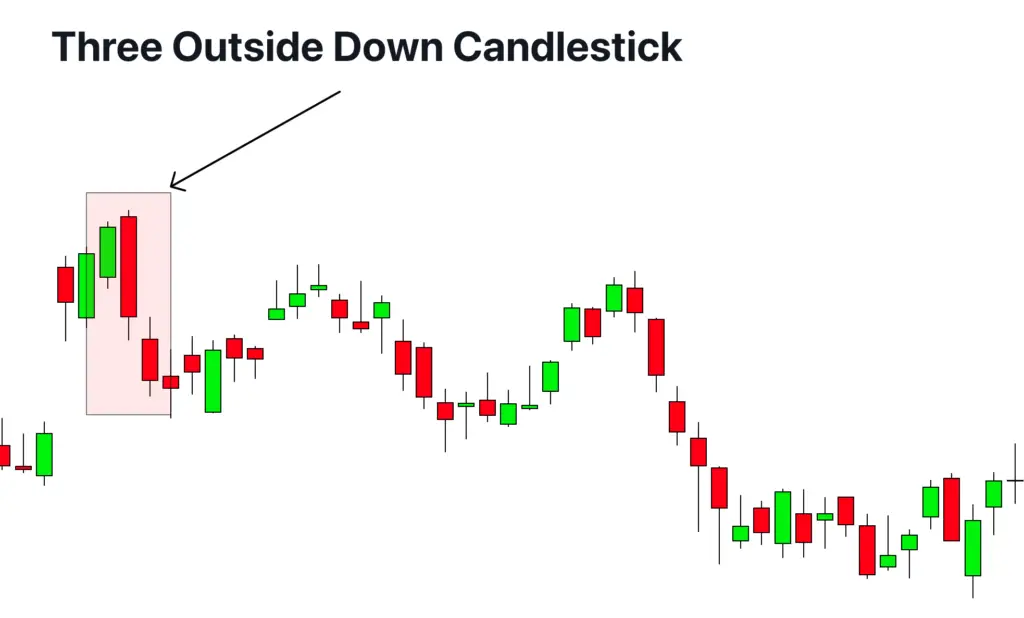
This pattern signals a strong change in market sentiment and, when correctly identified, can be an excellent early warning of a pending bearish reversal.
Significances and indications
The Three Outside Down candlestick pattern is a bearish reversal pattern that appears in an uptrend and signals a potential change in trend from bullish to bearish. This pattern holds significant importance because it indicates a shift in market sentiment, highlighting strong selling pressure that has the potential to reverse the prevailing uptrend.
The pattern is characterized by a small bullish candle, followed by a larger bearish candle that fully engulfs the first one, and a third bearish candle that closes lower than the second. This creates a visual representation of the switch in power from the buyers to the sellers. Traders often see this as a strong indication that the bullish trend has run its course, and the bears are taking control of the market.
Moreover, the Three Outside Down pattern has a higher level of reliability when it appears at market highs or key resistance levels, further bolstering its significance as a bearish reversal signal.
The psychology behind formation of Three Outside Down pattern
When the Three Outside Down pattern forms, it often indicates that large traders or institutions, who have the ability to move the market, are starting to take short positions or exit their long positions. The first candlestick represents the last attempt by the bulls to push the price higher, which is typically where retail traders are enticed to enter long positions, thinking the uptrend will continue.
However, the formation of the subsequent bearish candles shows that the big players are starting to sell or go short, causing the price to decline sharply and engulf the previous bullish candle. The third bearish candle, which closes lower than the second, further confirms the dominance of these sellers in the market.
When you spot this pattern, it can be a strong indication that the sentiment among large traders has turned bearish, which can cause the price to continue to drop in the following trading sessions. Retail traders can use this information to align their trading strategies with the direction large traders are likely to push the market.
Confirmation Tools to use
| Confirmation Tools for Three Outside Down Pattern | Description |
|---|---|
| 1. Key Level | The pattern forms near a known resistance level. This adds to the credibility of a potential reversal. |
| 2. Break of Low | After the pattern is formed, a break of the low of the third candle further confirms the bearish sentiment. |
| 3. High Volume | An increase in trading volume during the pattern formation indicates strong participation and validates the reversal. |
| 4. Oscillator Divergence | Look for bearish divergence on momentum oscillators like RSI or MACD, which can indicate weakening upward momentum. |
Key Points
- Best Timeframe: The Three Outside Down pattern can be spotted on various timeframes, but it tends to be more reliable on the daily and weekly charts as they filter out market noise.
- Trading Session: This pattern can emerge in any trading session, including New York, London, and Tokyo sessions. However, it may hold more weight when observed in sessions with higher volatility, such as the London-New York overlap session.
- Winning Ratio: While it varies due to market conditions and the trader’s skill set, a properly utilized Three Outside Down pattern can offer a rough winning ratio of around 65%.
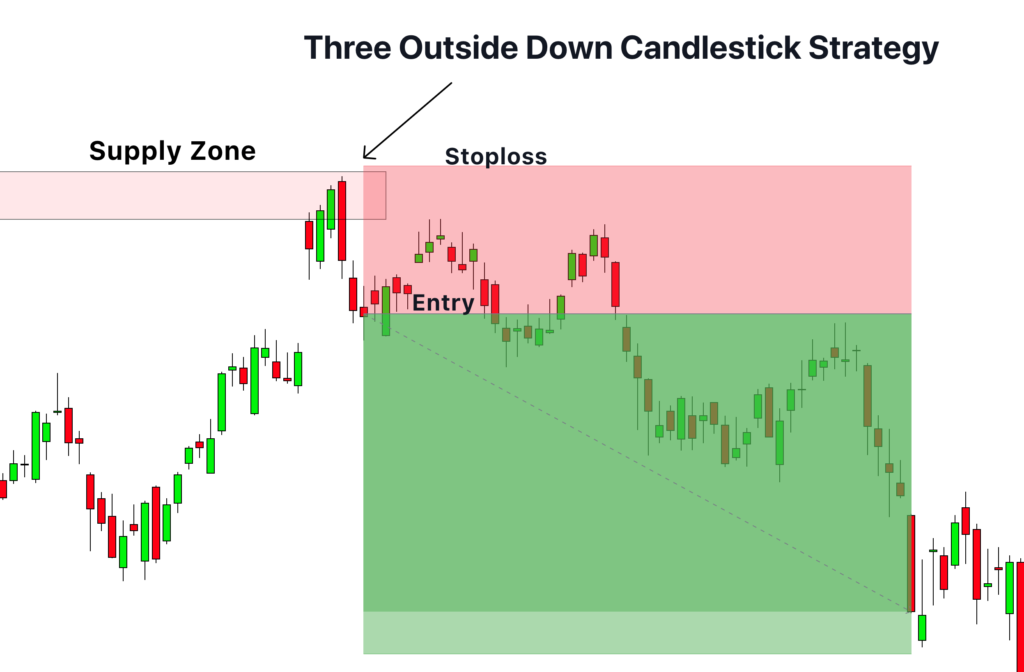
Trading Strategy with Supply Zone Confluence:
- Identify the Pattern and Supply Zone: Look for a Three Outside Down pattern forming near or at a known supply zone. The supply zone represents an area where sellers previously took control of the market, potentially signaling that they might step in again.
- Entry: Enter a short position when the third candle of the pattern closes lower, confirming the pattern. The confirmation of the pattern along with its occurrence in a supply zone increases the likelihood of a downward move.
- Stop Loss: Place a stop loss slightly above the high of the pattern (or the high of the supply zone if it’s higher). This location protects your trade if the pattern proves to be false and the price reverses its direction.
- Take Profit: Take profit at a level where previous support levels exist or where you anticipate potential demand zones (where buyers previously stepped in). Using a risk/reward ratio, such as 1:2 or 1:3, can also help to determine appropriate take profit levels.
Conclusion
The Three Outside Down pattern is a bearish reversal signal that can be a useful tool in a trader’s toolkit. Combining it with other aspects of technical analysis, like supply zones, can enhance its reliability. Remember, no pattern is 100% foolproof and it’s crucial to use prudent risk management techniques to protect your trading capital.

