The Accumulation/Distribution Line, or A/D Line, is not just a tool; it’s a trader’s compass, pointing toward potential treasures hidden in the ebbs and flows of market tides. Let’s embark on a journey to uncover the secrets of the A/D Line, a key to unlocking the mysteries of market movements.
What is the Accumulation/Distribution Line?
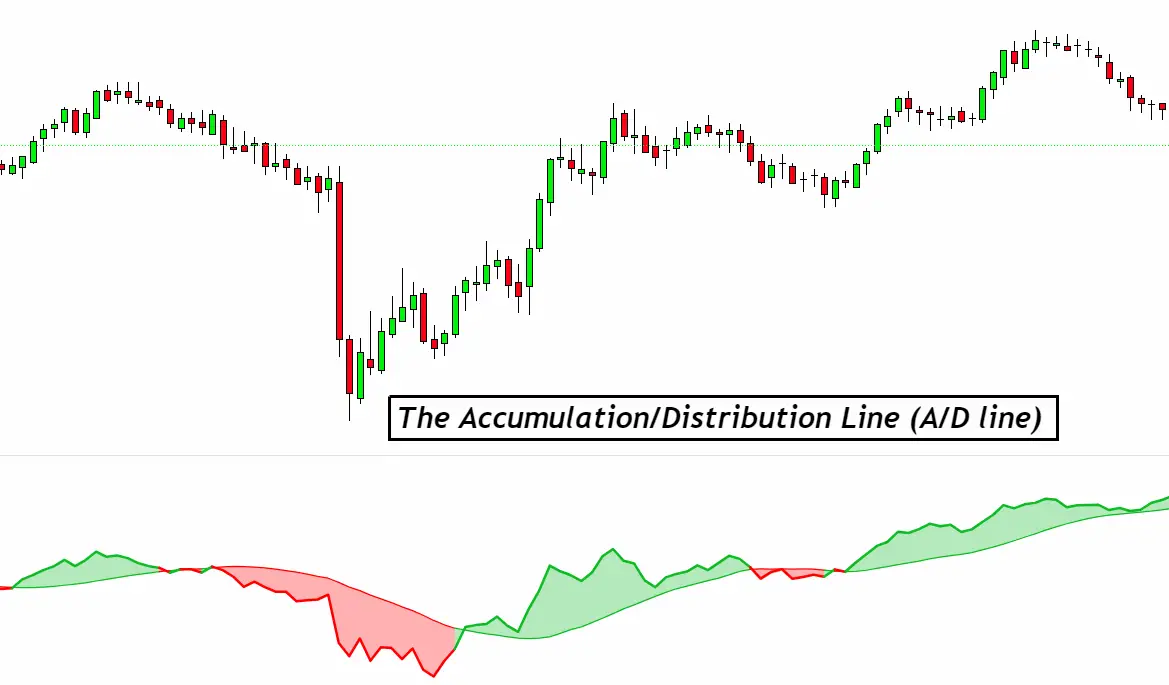
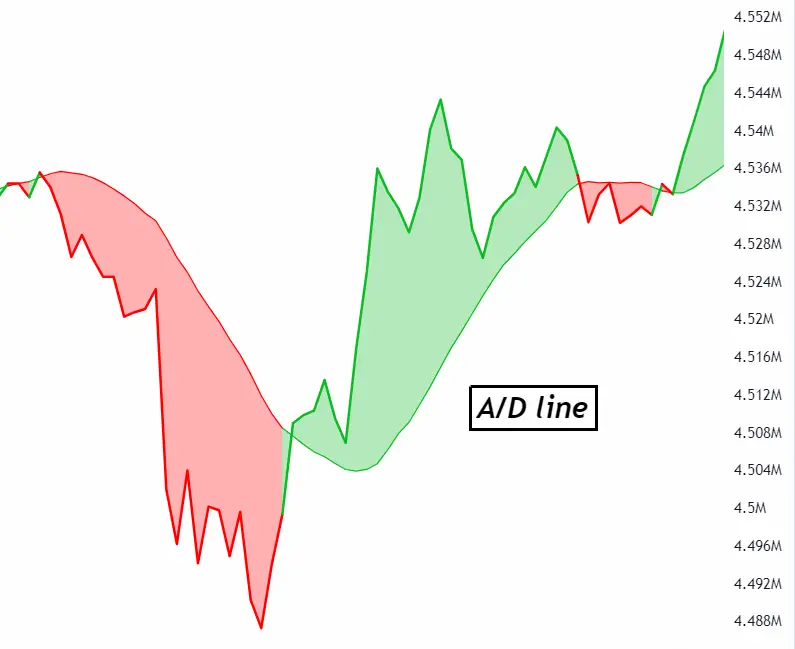
The Accumulation/Distribution Line, often abbreviated as A/D Line, is a powerful indicator in the forex trading world. It serves as a financial barometer, measuring the flow of money into or out of a currency pair. By doing so, the A/D Line offers insights into the underlying strength or weakness of market trends. It’s not just a line on a chart; it’s a narrative of market dynamics, telling stories of accumulation by buyers or distribution by sellers. This indicator bridges price action and volume, providing traders with a comprehensive view of market sentiment. Understanding the A/D Line is like learning the language of the markets, allowing traders to make more informed decisions.
How the A/D Line Works
The A/D Line works by marrying price movement and volume to give a comprehensive market view. It rises when buyers are in control, signaling accumulation. Conversely, it falls under sellers’ dominance, indicating distribution. Here’s the essence:
- Closing Price Position: The indicator examines where the closing price is within the day’s range.
- Volume Factor: It then multiplies this position by the day’s volume, adding weight to the price movement.
- Cumulative Total: This value is added or subtracted from a cumulative total, forming the A/D Line.
This process turns raw data into a vivid market story, making the A/D Line a go-to tool for spotting trends and reversals in the bustling forex markets.
Benefits of Using the The Accumulation/Distribution Line
Using the A/D Line in forex trading offers distinct advantages:
- Trend Confirmation: It helps confirm if a trend is backed by volume, adding confidence to your trades.
- Reversal Indication: Early warnings of potential trend reversals become visible, offering a strategic edge.
- Divergence Insights: Spot divergences between the A/D Line and price action to predict future movements.
Employing the A/D Line equips traders with deeper market insights, fostering more informed and strategic trading decisions.
Practical Tips for Applying the A/D Line
Incorporating the A/D Line into your trading strategy can enhance your market analysis. Here are practical tips:
- Combine with Price Action: Use the A/D Line alongside price charts to spot congruence or divergence.
- Look for Divergences: A divergence between the A/D Line and price may signal an upcoming reversal.
- Use with Other Indicators: Pair the A/D Line with indicators like Moving Averages or RSI for a robust analysis.
- Observe Trend Strength: An ascending A/D Line suggests strong buying pressure, while a descending line indicates selling pressure.
- Set Stop-Loss Points: Identify potential reversal points on the A/D Line to set stop-loss levels.
These tips can help traders leverage the A/D Line effectively, leading to more strategic and potentially profitable trades.
Common Mistakes to Avoid
When using the A/D Line in forex trading, sidestepping certain pitfalls can enhance your strategy:
- Ignoring Volume: The A/D Line integrates volume. Don’t overlook volume changes when interpreting the indicator.
- Overreliance: Relying solely on the A/D Line can mislead. Combine it with other analysis tools for a balanced view.
- Misreading Divergences: Not all divergences signal reversals. Confirm with additional indicators before acting.
- Neglecting Context: Market context matters. Analyze the A/D Line within broader market conditions for accuracy.
- Impatience: Avoid hasty decisions based on short-term A/D Line movements. Look for consistent patterns.
Avoiding these mistakes can lead to more effective and informed trading decisions, making the A/D Line a valuable part of your trading toolkit.
Advanced Techniques
For those ready to deepen their use of the A/D Line in forex trading, consider these advanced techniques:
- Multi-Timeframe Analysis: Study the A/D Line across different timeframes to get a panoramic view of market sentiment.
- Confluence Zones: Identify areas where the A/D Line aligns with other key indicators or support/resistance levels for stronger signals.
- Volume Oscillator Comparison: Compare the A/D Line with a volume oscillator to assess the strength of buying or selling pressure.
- Breakout Confirmation: Use the A/D Line to confirm breakouts by ensuring they’re supported by volume, enhancing trade reliability.
- Quantitative Models: Integrate the A/D Line into quantitative models for a systematic approach to trading decisions.
Employing these advanced strategies can offer nuanced insights, potentially leading to more sophisticated and informed trading maneuvers.
Conclusion
The Accumulation/Distribution Line stands as a cornerstone in forex trading, offering a window into the forces of supply and demand. Its ability to weave together price action and volume paints a vivid picture of market dynamics, aiding traders in navigating the complex forex waters. By confirming trends, signaling potential reversals, and uncovering hidden divergences, the A/D Line empowers traders to make more informed decisions. However, its true power unfolds when used judiciously, in concert with other analytical tools and within the context of a well-rounded trading strategy. Embrace the insights it offers, but tread with caution and curiosity, for the path to trading mastery is a journey of continuous learning and adaptation.

