Definition:
A rising wedge is a bearish chart pattern characterized by converging trendlines, where both trendlines are sloping upwards, signaling potential price reversal to the downside. Often observed in upward trending markets, the rising wedge indicates weakening momentum and suggests an impending downward shift in price.
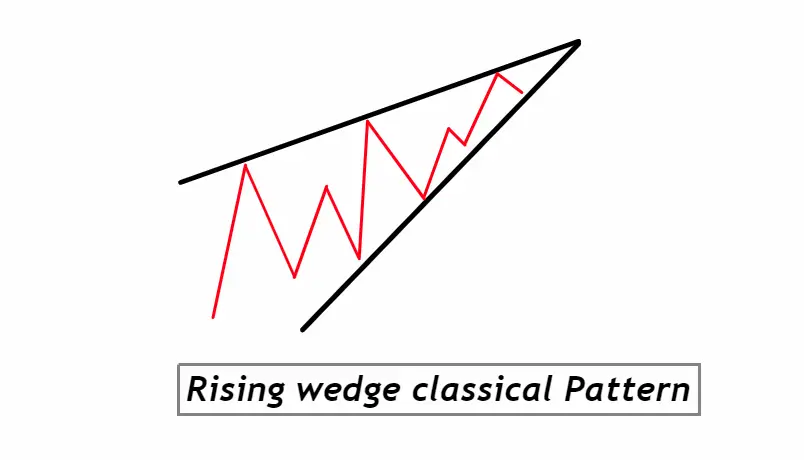
How to Identify the Rising Wedge Chart Pattern:
- Upward Sloping Trendlines: Look for two converging trendlines, where both are angling upwards.
- Price Compression: As the pattern develops, the price action should become more compressed, meaning the highs and lows start moving closer together, leading to the convergence of the trendlines.
- Volume Decline: Often, but not always, volume will decline as the pattern matures, indicating weakening momentum.
- Duration: While the pattern can form over various time frames, it’s typically observed over a few weeks to several months. The longer the duration, the more significant the potential price reversal may be.
- Consistent Series: Within the wedge, there should be a series of higher highs and higher lows, but the rate at which the highs increase should be slower than the lows, causing the narrowing effect.
- Breakout: For confirmation of the pattern’s completion and the anticipated price reversal, watch for a decisive price break below the lower trendline on increased volume.
Significance and Indications of the Rising Wedge Chart Pattern:
1. Impending Reversal: The rising wedge, particularly when observed after a prolonged uptrend, is a strong signal of a potential reversal. The converging trendlines indicate that while buyers are still pushing the price higher, they’re doing so with diminishing vigor. As the price reaches the apex of the pattern, the weakening momentum suggests that sellers are gaining control, hinting at a potential shift in the balance of power.
2. Volume Insights: The accompanying decline in volume as the pattern develops offers a supplementary bearish indication. When the breakout occurs, if it’s accompanied by a surge in volume, it further validates the anticipated price drop. For traders, a confirmed breakout with significant volume is often a green light for entering short positions or liquidating longs.
3. Price Target Estimations: Professional traders value the rising wedge not just for its bearish signal but also for its utility in setting price targets. By measuring the height of the pattern’s start to its peak, and projecting that downwards from the breakout point, traders can gauge potential price descent, aiding in risk management and profit-taking strategies.
4. Strategic Stop-Loss Placement: For traders acting on the rising wedge pattern, it provides a clear framework for risk management. A common practice is to place a stop-loss just above the upper trendline of the wedge, ensuring limited loss in case the expected downturn doesn’t materialize.
For new traders, recognizing and understanding the implications of the rising wedge can be invaluable. Not only does it offer insights into potential price movements, but it also provides a structured approach to trade management.
Activity of Big Traders during the Formation of a Rising Wedge:
1. Subtle Distribution: The rising wedge, particularly in an uptrend, often masks a discreet distribution phase by big traders or institutions. While the price appears to be climbing, these large players may be gradually offloading their positions, taking advantage of the remaining buying momentum to avoid drastically impacting the price. Retail traders, often focused on the upward trajectory, may not immediately perceive this distribution until the pattern matures.
2. Diminishing Conviction: As the pattern progresses, the buying force required to keep pushing the price up is typically dwindling. This often reflects decreased interest or conviction from institutional investors. Their reluctance to buy at higher prices, combined with their subtle selling, causes the price action to compress, leading to the convergence of the trendlines characteristic of the wedge.
3. Waiting for Confirmation: Big traders are aware that chart patterns, including the rising wedge, are watched by many in the market. Thus, they often wait for the pattern to confirm—i.e., a decisive break below the lower trendline—before accelerating their selling. This confirmation acts as a cue, intensifying the bearish move as both institutions and retail traders act on the pattern’s implications.
4. Exploiting Retail FOMO: The continued higher highs might induce FOMO (Fear of Missing Out) among retail traders, prompting them to buy into the seeming uptrend. Institutions can exploit this sentiment, further distributing their holdings to latecomers, before the anticipated decline.
Understanding the maneuvers of big traders during the formation of a rising wedge provides retail traders with a more nuanced view of the market dynamics at play. Recognizing these subtleties allows for more informed decision-making, aligning strategies with the underlying forces shaping the chart pattern.
Confirmation Tools for the Rising Wedge Pattern:
| Tool | Description |
|---|---|
| Key Support Levels | Identifying established support levels within the pattern. A break below a crucial support adds weight to the bearish outlook. |
| Break of Pattern Low | A decisive break below the lowest point formed during the pattern often signals a strong bearish momentum. |
| Volume Analysis | A sharp increase in selling volume during or after the breakout confirms the validity of the bearish move. |
| Technical Indicators | Indicators like the Relative Strength Index (RSI) showing overbought conditions or bearish divergences can bolster the reversal prediction. |
Utilizing a combination of these tools can enhance the reliability of the rising wedge pattern, allowing traders to make decisions with higher confidence and reduced risk.
Optimal Conditions for Trading the Rising Wedge Pattern:
Best Timeframe: For a more robust and significant outcome, the Daily timeframe is often favored, although the pattern can emerge in shorter or longer timeframes as well. On the Daily chart, noise is reduced and major market moves are better reflected.
Trading Session: The pattern’s breakout and confirmation are best traded during the major market sessions, such as the London or New York sessions, where liquidity and volume are highest, ensuring smoother price movements.
Winning Ratio: While it varies based on individual strategies and market conditions, with proper confirmation and discipline, traders can aim for a winning ratio of around 60-70% when trading this pattern. However, always remember that risk management is crucial, irrespective of the anticipated success rate.
By considering these optimal conditions, traders can better position themselves for success when trading the rising wedge pattern.
Rising Wedge Trading Strategy with Confluence:
1. Entry: Wait for the price to break below the lower trendline of the rising wedge. Add confluence by looking for supporting signals from other indicators or tools. For instance, a bearish candlestick pattern like an engulfing or shooting star post-breakout, or a bearish crossover in moving averages, can be your cue for entry.
2. Stop Loss: Place the stop loss slightly above the last high within the wedge or just above the upper trendline. This protects your position in case the breakout turns out to be a false one and the price moves back into the wedge.
3. Take Profit: Determine the potential drop by measuring the height at the widest part of the wedge and projecting that downwards from the breakout point. This gives you a target. However, also consider key support levels or zones as areas where price might reverse or stall.
Conclusion:
The rising wedge is a powerful pattern that suggests a bearish reversal, especially when found in an uptrend. When traded with confluence — using other supporting tools and indicators — it allows traders to make more informed and high-probability decisions. As with all trading strategies, disciplined risk management and regular review of one’s trades are key to long-term success.

