Definition:
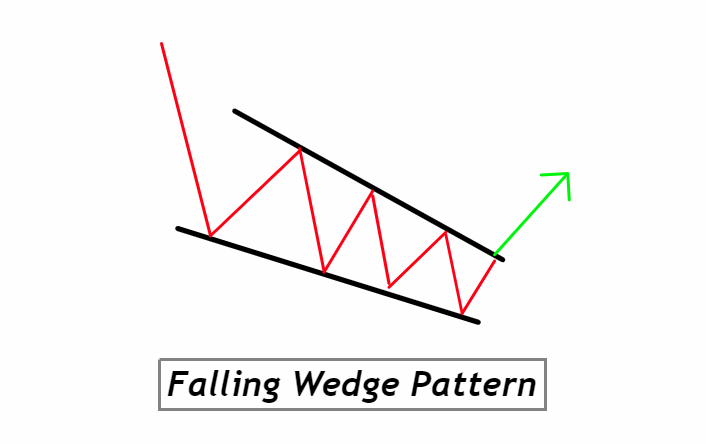
A falling wedge is a bullish reversal pattern characterized by converging downward sloping trendlines with decreasing volume, indicating potential upward price breakout. Often seen in downtrends, the falling wedge signals that the current selling momentum is losing steam, potentially paving the way for a bullish reversal.
How to Identify the Falling Wedge Pattern on a Chart:
- Converging Trendlines: Look for two trendlines – a descending resistance line and a descending support line – that converge as the pattern matures. The resistance line will generally be steeper than the support line.
- Decreasing Volume: As the pattern progresses, there should be a noticeable decrease in trading volume. This indicates a weakening downward momentum and hints at a potential breakout.
- Duration: The pattern can develop over a few weeks to several months. While it can sometimes be spotted on shorter time frames, its significance is higher on daily and weekly charts.
- Price Compression: As the trendlines converge, price action will become more compressed, suggesting the potential for a breakout.
- Bullish Confirmation: The pattern is confirmed when the price breaks above the descending resistance line, especially on increasing volume, signaling a potential bullish reversal.
- Re-test: After breaking out, the price might sometimes re-test the resistance-turned-support line before continuing its upward move. This re-test can offer a secondary entry point for traders.
Significance and Indications of the Falling Wedge Pattern:
1. Reversal Signal: The falling wedge is primarily known as a bullish reversal pattern. When spotted during a downtrend, it suggests that the downward momentum is waning. As the two trendlines converge and trading volume decreases, it indicates that sellers are losing strength and a potential change in market sentiment is on the horizon.
2. Reliability: While no chart pattern is foolproof, the falling wedge has gained respect among traders for its reliability, especially when it’s accompanied by other confirming technical indicators. A breakout from this pattern, particularly on increased volume, provides a more confident signal for a bullish trend reversal.
3. Clear Entry and Exit Points: For traders, one of the biggest advantages of the falling wedge is its ability to provide clear entry and exit points. Once the pattern is confirmed with a breakout above the descending resistance, it offers an entry point. Conversely, if the breakout fails and the price drops back within the wedge or below the lower trendline, it can be an exit signal or a stop-loss reference point.
4. Forecasting Potential: Not only does the falling wedge signal a potential trend reversal, but it can also provide traders with a price target. By measuring the height of the pattern at its widest point and projecting that distance from the breakout point, traders can estimate how far the ensuing bullish move might go. This gives a strategic advantage in planning both short-term and longer-term trades.
In essence, the falling wedge serves as a valuable tool in a trader’s arsenal, allowing for informed decision-making based on patterns that historically hint at future price movements.
Activity of Big Traders During the Formation of the Falling Wedge:
1. Accumulation: Often, the formation of a falling wedge can coincide with subtle accumulation by institutional or “big” traders. As retail traders are selling off their positions, driven by the prevailing bearish sentiment, smart money might be quietly accumulating positions in anticipation of a future price rise. This accumulation often isn’t immediately obvious, as the buying volume is counteracted by the larger selling volume of retail traders.
2. Decreasing Volume Significance: The declining volume observed during the formation of the wedge is not just a technical nuance; it signifies a decrease in selling pressure. Big traders are generally not initiating new short positions or selling off their assets; instead, they might be preparing for a shift in momentum. When volume starts to pick up again, especially during the breakout, it often indicates institutional participation, driving the price upwards.
3. Manipulation & False Breakouts: Sometimes, big traders might capitalize on the predictability of retail reactions to such patterns. They could trigger a false breakout to shake out weak hands or to stop out traders with tight stop losses, before moving the price in the anticipated bullish direction. This is why it’s essential for retail traders to wait for confirmation, such as a breakout with significant volume or a retest of the broken trendline, before taking a position.
4. Post-Breakout Movement: Once the falling wedge pattern confirms with a bullish breakout, institutional buying can drive the momentum further. This is because, as price breaks resistance and moves upward, many trading algorithms, as well as momentum-based traders, may jump into the buy trade, further propelling the price.
Understanding the activities and potential strategies of big traders during the formation and confirmation of the falling wedge can give retail traders an edge. It provides context to the price and volume changes they observe on the chart, allowing them to trade more confidently and strategically in what might seem like a chaotic market.
Confirmation Tools for the Falling Wedge Pattern:
| Tool/Indicator | Confirmation Significance |
|---|---|
| Key Level Break | A breakout above a significant resistance level (e.g., previous swing high) strengthens the bullish signal. |
| Post-Pattern Low Break | If the price makes a new low after initially breaking out of the wedge, it may indicate a false breakout or a more complex pattern formation. Monitor cautiously. |
| Volume Surge | A noticeable increase in volume during or after the breakout signifies strong buying interest, usually indicating a more reliable bullish reversal. |
| Supporting Indicators | Using other technical indicators (e.g., RSI moving above 50, MACD crossover) in tandem with the pattern can offer additional confirmation of a potential bullish trend. |
Traders should note that while these tools enhance the reliability of the falling wedge pattern, there’s no single combination that guarantees success. It’s essential to incorporate a comprehensive trading strategy and risk management practices.
Optimal Conditions for Trading the Falling Wedge Pattern:
Best Timeframe: While the falling wedge can be identified on multiple timeframes, the daily and weekly charts often provide the most reliable signals. Shorter timeframes might produce more patterns, but they can also come with increased noise and false signals.
Trading Session: The pattern’s reliability increases during the main trading sessions of the asset in question. For Forex, for instance, it would be during the London and New York overlap. For stocks, it would be the regular trading hours of the stock exchange where the asset is listed.
Winning Ratio: Historically, the falling wedge pattern has a winning ratio ranging from 60-70%. However, this number can vary based on market conditions, the asset traded, and the trader’s skill in identifying and acting on the pattern. Always backtest and practice before implementing any strategy live.
Falling Wedge Pattern Trading Strategy with Confluence:
1. Entry Point:
- Await the breakout of the falling wedge pattern above the descending resistance.
- Add confluence: Look for other confirming signals like a significant volume surge during breakout, or a key resistance level being breached. Additional technical indicators, like an RSI moving above 50 or a bullish MACD crossover, can also provide added assurance.
2. Stop Loss:
- Place the stop loss just below the most recent swing low within the wedge or below the lower trendline of the wedge. This ensures that you’re protected in case the breakout is false or if the pattern evolves into a more complex structure.
3. Take Profit Level:
- Measure the height of the wedge at its widest point. Project that distance from the breakout point to get an approximate target.
- For added confluence, cross-reference this target with significant resistance levels or Fibonacci extensions to identify potential obstacles or profit-taking zones.
Conclusion:
The falling wedge pattern offers traders a potential edge with its bullish reversal signal. By incorporating elements of confluence and following a structured trading strategy, traders can increase the probability of successful trades. As always, it’s essential to practice sound risk management and continuously evaluate the effectiveness of the strategy in evolving market conditions.

