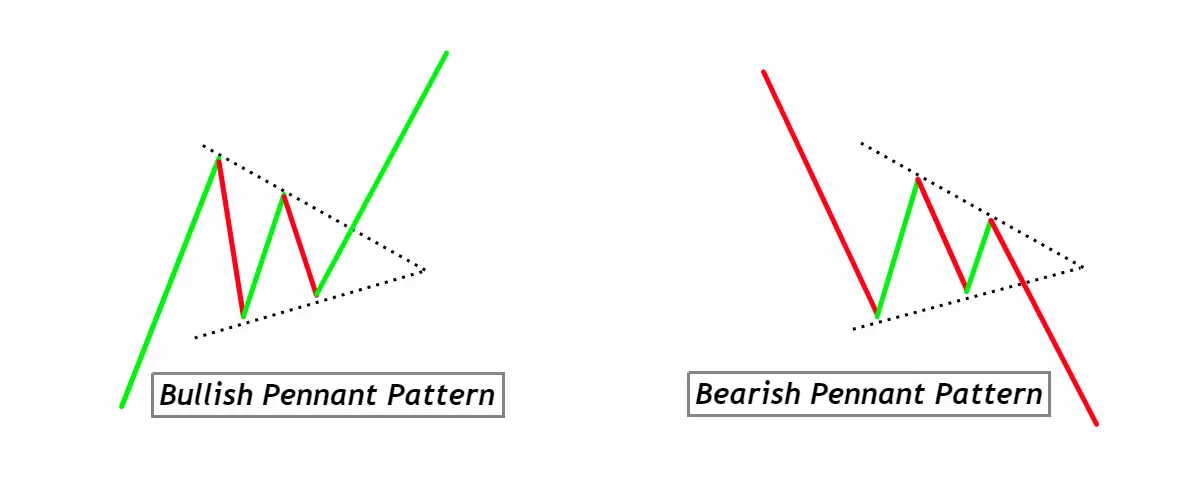
Bullish Pennant:
A consolidation pattern that follows a strong upward move, suggesting a continuation of the uptrend after breakout.
Bearish Pennant:
A consolidation pattern that follows a strong downward move, indicating a continuation of the downtrend after breakout.
Pennant patterns, either bullish or bearish, are brief consolidation phases after significant price movements, signaling potential trend continuations upon breakout.
Identifying the Bullish & Bearish Pennant Pattern on the Chart:
- Initial Move:
- Bullish Pennant: Look for a strong upward move on the chart, known as the flagpole.
- Bearish Pennant: Look for a strong downward move on the chart, also referred to as the flagpole.
- Consolidation Phase:
- The price movement will then enter a period of consolidation, forming a small symmetrical triangle or a flag-like pattern. This phase should have converging trendlines, representing a pause in the prevailing trend.
- Volume Analysis:
- Bullish Pennant: Typically, there will be a decrease in volume during the consolidation phase and an increase once the upward breakout occurs.
- Bearish Pennant: Volume often diminishes during the consolidation and increases on a downward breakout.
- Duration:
- Pennant patterns are short-term patterns, usually lasting from one to four weeks. If they persist for longer, they might be considered symmetrical triangles.
- Breakout Confirmation:
- Bullish Pennant: A breakout above the upper trendline of the pennant with increased volume signals a continuation of the prior uptrend.
- Bearish Pennant: A breakout below the lower trendline with increased volume indicates a continuation of the preceding downtrend.
- Return to the Pattern (optional):
- Sometimes, after a breakout, the price may return to the previous trendline of the pennant for a ‘retest’ before continuing in its breakout direction. This can offer another entry opportunity for traders.
Significance and Indications of the Pennant Pattern:
- Reliable Continuation Indicator: Pennant patterns are seen as reliable continuation patterns in the realm of technical analysis. When they emerge after a significant price move, they often indicate a pause in the market, allowing traders and investors to gather their bearings before the next move. A confirmed breakout from the pennant, in the direction of the preceding trend, typically suggests that the market has gathered enough momentum to continue in its original direction.
- Volume Confirmation: One of the critical factors that add to the reliability of the pennant pattern is its association with volume. A decrease in volume during the formation of the pennant and a sharp increase upon breakout serves as a robust confirmation signal. This volume behavior underscores the market’s consensus about the impending move, making the pattern a strong forecasting tool.
- Defined Risk and Reward: For traders, one of the notable advantages of the pennant pattern is the ability to set clear stop-loss and profit-target levels. The boundaries of the pennant can be used to place stops, and the length of the initial flagpole can offer an estimation for the potential price move post-breakout. This clear structure allows traders to manage their risk effectively and aim for optimal returns.
In conclusion, the pennant pattern is a favorite among traders because of its predictive power, clear structure, and the role of volume in confirming its legitimacy. When correctly identified and used in conjunction with other analytical tools, it offers traders an edge in anticipating future price moves.
Activity of Big Traders During Pennant Pattern Formation:
- Accumulation and Distribution: The initial sharp move that forms the flagpole in a pennant pattern often represents a significant buying (in bullish pennants) or selling (in bearish pennants) activity by institutional or big traders. This movement could be due to them accumulating (buying) or distributing (selling) large positions, causing the price to move strongly in a particular direction.
- Consolidation Phase – Strategic Positioning: The subsequent consolidation phase (the actual pennant) represents a period where these big traders are evaluating their positions. They might be taking partial profits, hedging, or waiting for more data before committing further. For retail traders, this is a phase of uncertainty, but big traders use this time to solidify their strategies, often leading to the continuation of the prior trend.
- Volume Dynamics: The decrease in volume during the pennant formation can often be attributed to the hesitation of retail traders and the lack of major moves from big players. The breakout’s increased volume, whether upward in bullish pennants or downward in bearish ones, can signal renewed commitment from institutional traders, pushing the trend forward.
- Testing the Waters: Sometimes, big traders might execute smaller trades to test the market’s reaction during the consolidation phase. If the market doesn’t resist these test trades, they might become more confident in their larger positions, leading to the continuation signaled by the pennant breakout.
Understanding the actions and strategies of institutional or big traders during the formation of a pennant pattern can provide retail traders with a clearer perspective of the market’s potential direction. By recognizing these underlying dynamics, retail traders can position themselves more effectively and ride the wave created by the market’s major players.
Confirmation Tools for High Probability Pennant Pattern Recognition
| Tool | Description |
|---|---|
| Key Support/Resistance Levels | Watch for the pennant’s formation near significant support (for bullish) or resistance (for bearish) levels. A breakout or breakdown from these zones adds weight to the pattern’s validity. |
| Break of Initial Move’s Low/High | In a bullish pennant, if prices break below the initial upward move’s low, it could invalidate the pattern. Similarly, in a bearish pennant, a break above the initial downward move’s high can be a warning sign. |
| Volume Analysis | A surge in volume during the breakout confirms the pattern’s strength. Decreasing volume during the pennant’s formation followed by a spike on breakout is a strong indicator of trend continuation. |
| Technical Indicators | Utilize oscillators like the RSI or MACD. In bullish pennants, look for hidden bullish divergence or an RSI staying above 50. For bearish pennants, hidden bearish divergence or an RSI remaining below 50 can provide extra confirmation. |
Traders should note that while these tools enhance the probability of a valid pennant pattern, no single tool or combination guarantees success. Using them collectively, however, provides a more comprehensive and nuanced view of the market’s likely direction.
Optimal Trading Parameters for Pennant Patterns
Best Timeframe: For day trading, the 15-minute to 1-hour charts offer a good balance of detail and broader trend recognition. For swing trading, daily charts are often preferred to capture more significant price movements over several days to weeks.
Trading Session: The pattern is most effective during the main trading hours of the relevant market, when liquidity and volume are at their peak. For Forex, the overlap of London and New York sessions; for stocks, the first few hours after the market opens.
Winning Ratio: While dependent on individual strategy and market conditions, with proper confirmation tools, traders can expect a winning ratio of approximately 60-70%. However, it’s essential to ensure risk management and not solely rely on win rate.
Pennant Pattern Trading Strategy with Confluence
- Entry:
- Bullish Pennant: Enter a long position after the price breaks above the upper trendline of the pennant, especially when this breakout is accompanied by a significant volume spike.
- Bearish Pennant: Enter a short position after the price breaks below the lower trendline of the pennant, confirmed by a notable volume increase.
- Confluence Factors:
- Key Support/Resistance Levels: Ensure the breakout or breakdown happens near significant support (for bullish) or resistance (for bearish) zones, adding another layer of validation.
- Technical Indicators: Use oscillators like RSI or MACD to confirm the breakout direction. For instance, an RSI above 50 during a bullish breakout or an RSI below 50 for a bearish breakout.
- Price Action Cues: Look for other price action signals, like engulfing candles or pin bars, at the breakout point to add more validation to the entry.
- Stop-Loss:
- Bullish Pennant: Place the stop-loss just below the lowest point of the pennant or below the last swing low before the breakout.
- Bearish Pennant: Position the stop-loss just above the highest point of the pennant or above the last swing high before the breakout.
- Take Profit:
- Set a profit target equal to the length of the initial flagpole. For instance, if the flagpole height is 100 pips, aim for a 100-pip move after the breakout. Adjust this based on significant support or resistance levels ahead.
Conclusion:
The Pennant Pattern, when combined with confluence factors, offers traders a structured approach to capitalize on trend continuation opportunities. While it provides clear entry, stop-loss, and take-profit levels, traders should always factor in market conditions and use proper risk management to ensure optimal trading outcomes.


Hi
I think this will help me more as I am training myself on Binary option.
Please send more of this Infor