Definition
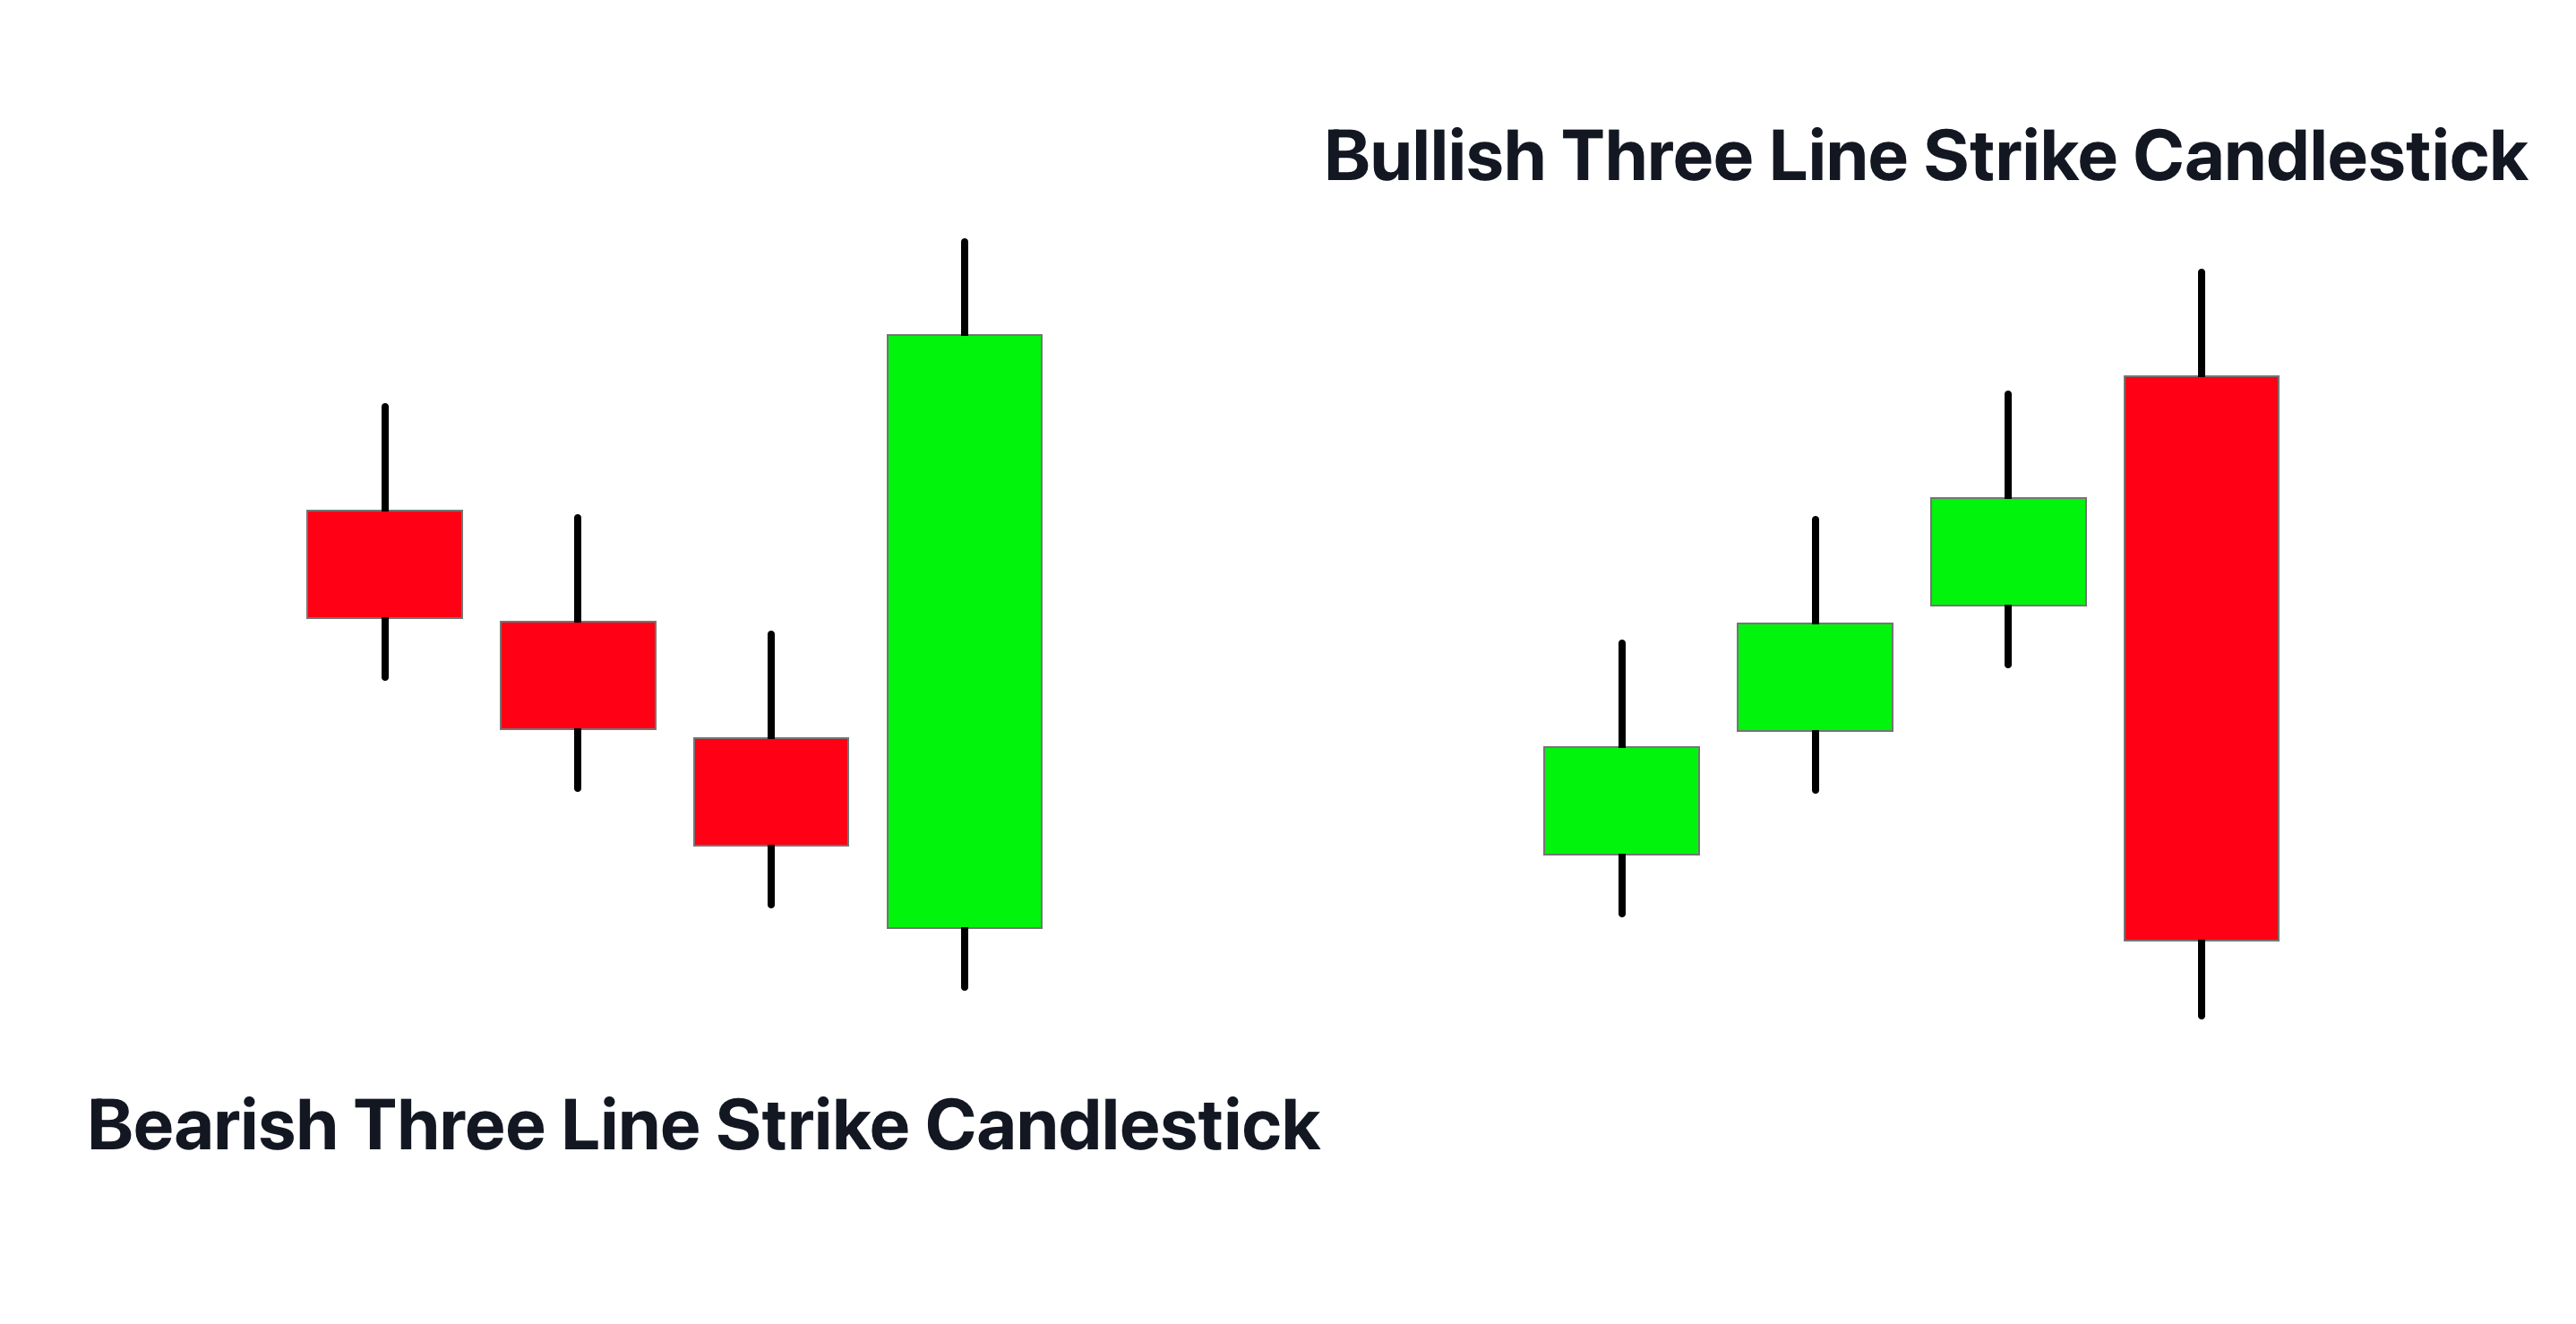
The Three-Line Strike pattern is a four-candlestick formation that signifies a potent reversal in the market; it consists of three consecutive candles of the same color, followed by a fourth candle of the opposite color that opens in the direction of the prevailing trend but closes beyond the start of the first candle.
It often serves as a strong indicator of a sudden and forceful shift in trader sentiment and market direction.
How to identify the Three Line Strike Candlestick Pattern?
To identify a Three-Line Strike pattern on a chart, traders can follow these steps:
- Trend Identification: First, identify a clear trend in the market. The Three-Line Strike pattern can form in both uptrends (bullish Three-Line Strike) and downtrends (bearish Three-Line Strike).
- Three Similar Candles: Look for a series of three consecutive candles that are the same color and moving in the direction of the current trend. In a bullish Three-Line Strike, these will be three consecutive green (or white) candles, each closing higher than the previous. In a bearish pattern, they will be red (or black) candles, each closing lower.
- The Striking Candle: The fourth candle in the pattern is the “strike”. This candle opens in the direction of the prevailing trend, but closes in the opposite direction, beyond the opening of the first of the three similar candles. In a bullish pattern, the striking candle will be red (or black) and in a bearish pattern, it will be green (or white).
- Candle Sizes: Each of the first three candles should be of approximately the same size, signifying consistent momentum. The striking candle, however, should be longer, demonstrating a strong shift in momentum.
Significance
The Three-Line Strike pattern is a significant reversal indicator in technical analysis. Its importance lies in its strong visual demonstration of a potential shift in market sentiment, marking the potential end of a trend and the beginning of a counter-trend.
In a bullish Three-Line Strike, three consecutive green (or white) candles are followed by a red (or black) candle that “strikes” back, covering the range of the previous three candles and closing below the first candle’s opening. This indicates that despite the uptrend, sellers managed to take control and drive the price down, suggesting a potential reversal to a downtrend.
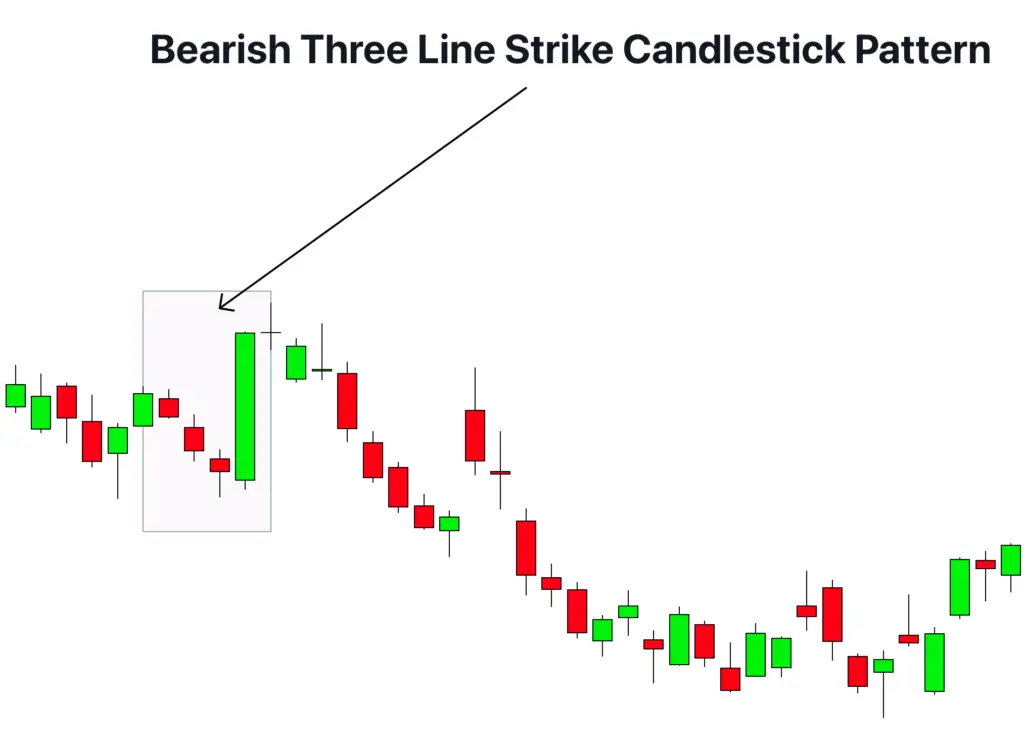
Similarly, in a bearish Three-Line Strike, three red (or black) candles are followed by a green (or white) candle that “strikes” back, covering the range of the previous three candles and closing above the first candle’s opening. This shows that despite the downtrend, buyers took control and pushed the price up, implying a possible reversal to an uptrend.
Activity of Market makers during formation of Three Line Strike Candlestick
When the Three-Line Strike pattern forms, it often signifies major shifts in the dynamics between buyers and sellers, reflecting notable changes in the market sentiment. This change typically coincides with increased activity from larger, institutional traders.
In a bullish Three-Line Strike scenario, the three consecutive bullish candles suggest sustained buying pressure, often influenced by the actions of big traders. However, the emergence of the bearish ‘strike’ candle implies that these major players may have begun to offload their positions, leading to a sharp increase in selling pressure that can signal a potential market reversal.
Conversely, in a bearish Three-Line Strike scenario, the three consecutive bearish candles indicate persistent selling pressure. If a bullish ‘strike’ candle emerges, it often suggests that big traders have begun accumulating assets, leading to a surge in buying pressure that can signal the start of an uptrend.
The insight into the activity of large traders can be particularly beneficial for retail traders. By being aware of the potential for a significant shift in the direction of the market, they can adjust their trading strategies accordingly, either by securing their positions or preparing to capitalize on the upcoming trend change.
Candlestick confirmation tools
To increase the probability of successfully trading the Three-Line Strike pattern, you can use the following tools for confirmation:
- Key Level: If the pattern forms around significant support or resistance levels, it can enhance its reliability. These key levels can often serve as ‘decision points’ where big traders may choose to enter or exit positions, potentially leading to price reversals.
- Break of High or Low: In a bullish Three-Line Strike, a break above the high of the three bullish candles (or conversely, a break below the low of the three bearish candles in a bearish Three-Line Strike) can act as a strong confirmation of the pattern.
- High Volume: A spike in trading volume during the formation of the ‘strike’ candle can suggest increased activity from big traders, supporting the possibility of a reversal.
- Technical Indicators: Indicators such as the Relative Strength Index (RSI) or Moving Average Convergence Divergence (MACD) can help confirm the momentum shift indicated by the Three-Line Strike pattern. For example, divergences between the price action and these indicators can reinforce the reversal signal.
Key Points
Best Timeframe: The Three-Line Strike pattern can be found across various timeframes, but it tends to be most reliable on the daily and weekly charts. The higher the timeframe, the more significant the pattern, as it encompasses more trading activity.
Trading Session: This pattern is relevant in all trading sessions, including the New York, London, and Asian sessions. However, the pattern may be more significant in the session that corresponds with the market for the asset being traded due to higher liquidity.
Winning Ratio: An approximate winning ratio for the Three-Line Strike pattern is around 65-70%.
Trading Strategy with Key Level Confluence
Here is have explained a simple trading strategy by adding the confluence of key levels on the price chart.
- Entry: Look for the Three-Line Strike pattern to form at a key level of support or resistance. The pattern should be in line with the prevailing trend. The entry point would be at the open of the next candle after the pattern is formed. If the pattern is bullish, buy at the opening price of the next candle. If the pattern is bearish, sell at the opening price of the next candle.
- Stop-Loss: The stop-loss should be placed below the low of the Three-Line Strike pattern for a bullish setup, and above the high of the pattern for a bearish setup. This gives the trade room to breathe while protecting you from significant losses if the market moves against your trade.
- Take Profit: The take profit should be at least twice the distance of your stop-loss to maintain a good risk-to-reward ratio. Alternatively, you can use key levels of support or resistance as your take profit levels, or use trailing stops to lock in profits as the trade moves in your favor.
Conclusion
The Three-Line Strike pattern is a powerful candlestick pattern that signals potential reversals in the market. When combined with key levels of support or resistance, it can provide high-probability trading setups. However, like any trading strategy, it is not foolproof and should be used in conjunction with good risk management and other technical analysis tools to increase its effectiveness.

