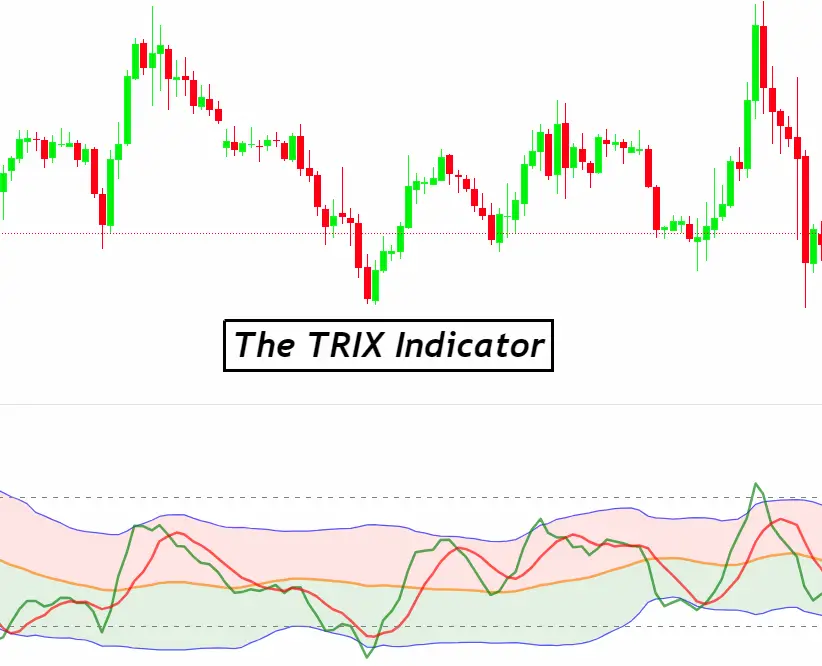
The TRIX Indicator, short for Triple Exponential Average, is a momentum oscillator that traders use to spot overbought or oversold conditions in a market. It does this by applying a triple smoothing of price data, which helps to filter out insignificant price movements or “market noise.” At its core, the TRIX Indicator measures the rate of change of a triple exponentially smoothed moving average of a security’s closing price. Its unique calculation minimizes lag and enhances the accuracy of trend signals, making it a favorite among forex traders looking for precise market entry and exit points. The TRIX oscillates around a zero line, with positive values indicating an upward momentum and negative values signaling a downward momentum, thus providing clear insights into market trends.
Key Features of the TRIX Indicator
- Exponential Smoothing: The TRIX uses triple exponential smoothing to iron out market noise and highlight significant trends.
- Rate of Change: It focuses on the rate of change in prices, offering a dynamic view of market momentum.
- Zero Line Crossover: The indicator oscillates around a zero line, where crossovers signal potential trend reversals.
- Signal Line: Often, a signal line (a moving average of the TRIX values) is added to identify turns and trend confirmations.
- Versatility: Traders use the TRIX for various purposes, including generating buy/sell signals and confirming trends.
- Divergence: Divergences between the TRIX and price action can indicate potential reversals or trend continuations.
How to Use the TRIX Indicator in Forex Trading
- Trend Identification: Watch the TRIX line. If it’s above zero, the trend might be upward. Below zero could indicate a downward trend.
- Signal Line Crossovers: Buy when the TRIX crosses above its signal line. Sell when it crosses below.
- Zero Line Crosses: Consider buying when the TRIX crosses above zero. A cross below zero might suggest selling.
- Divergence: Look for discrepancies between the TRIX and price action. Divergence can signal potential reversals.
- Combine with Other Indicators: Use the TRIX alongside other indicators like moving averages or RSI for confirmation.

Benefits of Using the TRIX Indicator
- Reduces Noise: Triple smoothing helps eliminate minor price fluctuations, focusing on significant trends.
- Clear Trend Signals: Its zero line crossovers provide straightforward bullish or bearish trend indications.
- Timely Entries and Exits: The TRIX helps pinpoint optimal trade entry and exit points, enhancing potential profitability.
- Divergence Detection: Spotting divergences with the TRIX can alert traders to potential reversals before they happen.
- Versatile Tool: Suitable for various trading styles, from day trading to swing trading, by adjusting its settings.
Tips for Maximizing the Effectiveness of the TRIX Indicator
- Adjust Settings: Tailor the TRIX period to match your trading style. Shorter periods for day trading, longer for swing trading.
- Signal Line: Add a signal line for clearer buy or sell signals through crossovers.
- Market Context: Consider the overall market trend. The TRIX works best in trending markets.
- Confirm with Other Indicators: Use alongside volume indicators or other momentum oscillators for confirmation.
- Practice Patience: Wait for clear signals. The TRIX might lag, so patience can lead to more reliable entries and exits.
- Monitor Divergences: Keep an eye on divergences between the TRIX and price as early indicators of potential reversals.
- Backtest Strategies: Before applying in live trading, backtest your TRIX-based strategy to ensure its effectiveness in different market conditions.
Real-Life Application: TRIX Indicator in Action
Imagine a forex trader named Alex. Alex decides to apply the TRIX Indicator to a EUR/USD daily chart, aiming to enhance trading decisions. Here’s how Alex successfully uses the TRIX:
- Setting Up: Alex sets the TRIX period to 15 days, finding it a good balance for swing trading.
- Identifying a Trend: The TRIX line crosses above the zero line, suggesting an upward trend. Alex considers this a signal to look for buying opportunities.
- Confirming with a Signal Line: A few days later, the TRIX crosses above its signal line. This reinforces Alex’s belief in the bullish trend.
- Observing Divergence: At one point, the EUR/USD price hits a new high, but the TRIX fails to follow. Alex sees this as a divergence, signaling a possible trend reversal.
- Making a Decision: Based on the TRIX signal and the divergence observed, Alex decides to close the buy position before the trend reverses, securing profits.
- Reflecting on the Trade: The TRIX later crosses below the zero line, confirming the trend reversal. Alex is satisfied with the decision to exit the trade early, acknowledging the TRIX Indicator’s role in this successful trade.
Conclusion
In the dynamic realm of forex trading, the TRIX Indicator emerges as a formidable tool, offering traders a refined lens through which to view market momentum and trends. Its unique triple smoothing technique effectively filters out market noise, providing clearer signals for entry and exit points. Whether you’re a seasoned trader or just starting out, incorporating the TRIX Indicator into your trading strategy can significantly enhance your market analysis and decision-making process. Embrace the power of the TRIX to navigate the forex markets with greater confidence and precision, and take your trading to new heights.

