Introduction
The Stochastic Oscillator is a momentum indicator. It shows the location of the close relative to the high-low range. Developed in the 1950s by George Lane, it helps predict price turns. Traders use it to spot overbought and oversold conditions. This tool is popular in Forex trading. It aids in making informed decisions by highlighting potential entry and exit points.
Understanding the Stochastic Oscillator
The Stochastic Oscillator is a momentum indicator used in technical analysis to gauge the momentum of asset prices by comparing a particular closing price of an asset to a range of its prices over a certain period of time. Here’s a breakdown to help you understand how it works:
Basic Concept
- Momentum: The Stochastic Oscillator is based on the idea that as prices increase, closing prices tend to be closer to the high end of the price range. Conversely, as prices decrease, closing prices tend to be near the low end of the price range.
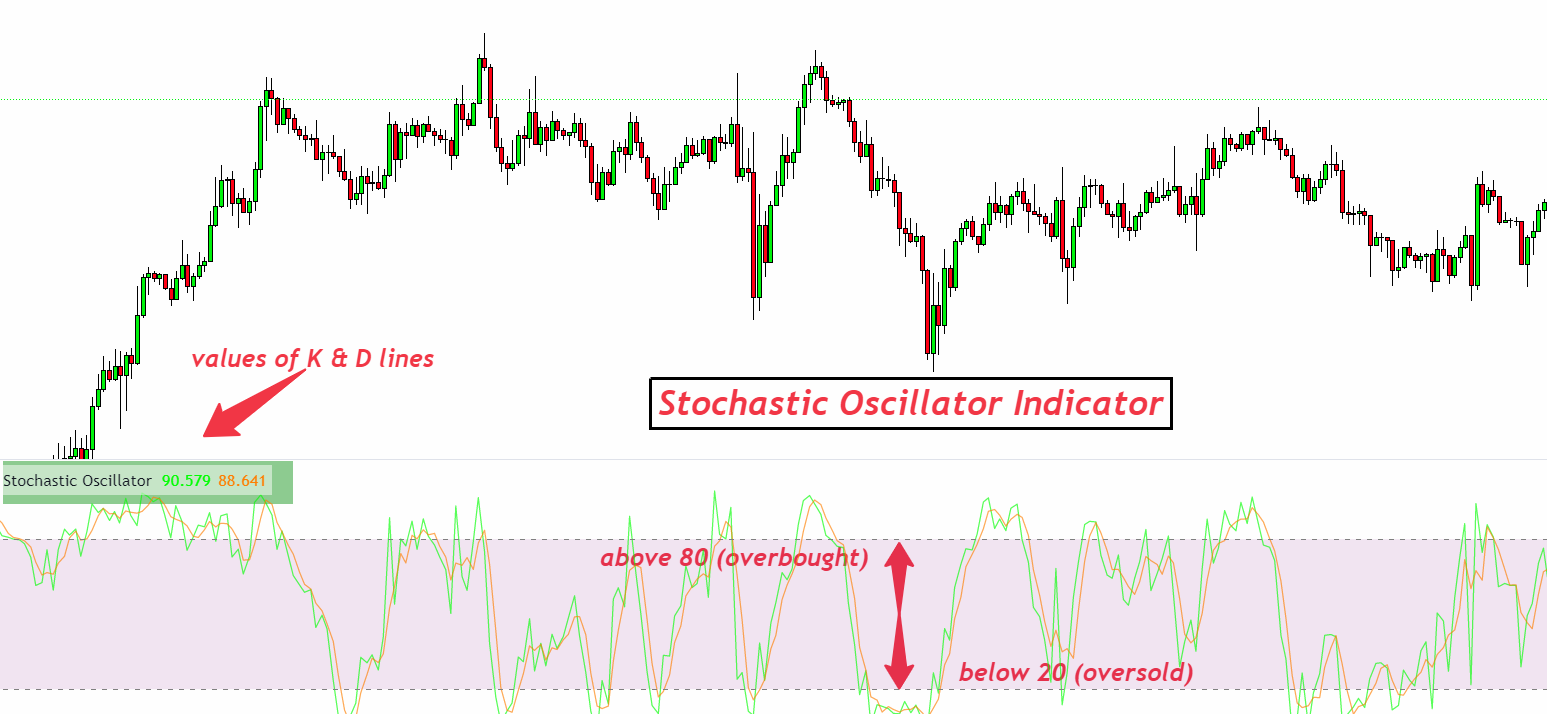
- Components: The oscillator consists of two lines, the %K line (fast stochastic) and the %D line (slow stochastic), which move within a bounded range of 0 to 100.
%K Line (Fast Stochastic)
- The %K line is the main line and indicates the current market momentum.
- It compares the latest closing price to the highest and lowest prices over a specified period, typically 14 periods.
%D Line (Slow Stochastic)
- The %D line is a moving average of the %K line, which helps to smooth out the %K line’s movements and provide clearer signals.
- It’s typically calculated as a 3-period moving average of the %K line.
Formula and Calculation
The Stochastic Oscillator is calculated using the following formulas:
- %K = [(Current Close – Lowest Low) / (Highest High – Lowest Low)] * 100
- %D = 3-period moving average of %K
Where:
- “Current Close” is the most recent closing price.
- “Lowest Low” is the lowest price over the specified period.
- “Highest High” is the highest price over the specified period.
Interpretation
- Values above 80 indicate an overbought condition, suggesting that the price may start falling.
- Values below 20 indicate an oversold condition, suggesting that the price may start rising.
- Traders watch for crossovers between the %K and %D lines as potential buy or sell signals, especially when they occur outside of the 20-80 range.
Understanding the Stochastic Oscillator involves recognizing its ability to signal potential reversals by comparing the location of a closing price relative to its recent price range, providing valuable insights into market momentum and potential price movements.
Interpretation of Stochastic Oscillator
Interpreting the Stochastic Oscillator involves analyzing its two main lines (%K and %D) within the context of a 0 to 100 scale to identify potential price momentum shifts and market conditions. Here’s how traders typically interpret the signals from the Stochastic Oscillator:
Overbought and Oversold Levels
- Overbought Condition: When the Stochastic lines rise above 80, the market is considered overbought. This suggests that the price may be high relative to its usual range, indicating a potential reversal or pullback.
- Oversold Condition: When the Stochastic lines fall below 20, the market is considered oversold. This suggests that the price may be low relative to its usual range, indicating a potential upward correction.
Stochastic Crossovers
- Bullish Crossover: A bullish signal is generated when the %K line crosses above the %D line, especially below the 20 level. This indicates rising momentum and a potential upward price movement.
- Bearish Crossover: A bearish signal is generated when the %K line crosses below the %D line, especially above the 80 level. This indicates falling momentum and a potential downward price movement.
Divergence Signals
- Bullish Divergence: Occurs when the price records a lower low, but the Stochastic Oscillator forms a higher low. This suggests weakening downward momentum and a potential bullish reversal.
- Bearish Divergence: Occurs when the price records a higher high, but the Stochastic Oscillator forms a lower high. This suggests weakening upward momentum and a potential bearish reversal.
Mid-Range Crossovers
- Signals can also occur within the 20 to 80 range, though they’re generally considered weaker. A crossover in the mid-range can still indicate a shift in momentum and might be used in conjunction with other indicators for confirmation.
Consistency with Trend
- The Stochastic Oscillator can also be used to confirm trend directions. In a strong uptrend, the Stochastic lines tend to remain in the overbought area for an extended period, while in a downtrend, they may stay in the oversold area.
Interpreting these signals requires careful consideration of the market context, as the Stochastic Oscillator can generate false signals in volatile or trending markets. Combining this tool with other forms of analysis, like trend lines and moving averages, can provide more reliable insights.
Application in Forex Trading
The Stochastic Oscillator is a versatile tool in Forex trading, offering insights into potential entry and exit points by identifying overbought and oversold conditions, momentum shifts, and divergence signals. Here’s how to apply the Stochastic Oscillator in Forex trading:
Setting Up the Stochastic Oscillator
- Platform Integration: Most trading platforms include the Stochastic Oscillator as a standard analytical tool. You can typically add it to your chart with a few clicks.
- Configuration: Set the %K and %D periods according to your trading strategy. The common setting is 14 for %K and 3 for %D, but this can be adjusted for more sensitivity or smoothing.
Combining with Other Technical Analysis Tools
- Trend Confirmation: Use the Stochastic Oscillator in conjunction with trend indicators like moving averages to confirm the direction of the trend. For instance, consider bullish signals more reliable when they occur above a moving average in an uptrend.
- Support and Resistance Levels: Combine Stochastic signals with identified support and resistance levels to increase the reliability of overbought and oversold signals.
- Price Patterns and Candlestick Formations: Integrate Stochastic signals with price patterns (e.g., head and shoulders, triangles) and candlestick formations (e.g., doji, engulfing patterns) to pinpoint entry and exit points more accurately.
Trading Strategies Using the Stochastic Oscillator
- Trend Following: In an uptrend, look for Stochastic readings to drop below 20 and then rise back above to signal a buying opportunity. In a downtrend, look for readings to go above 80 and then fall back below as a selling signal.
- Reversal Trading: Use overbought and oversold conditions to identify potential price reversals. For instance, in an overbought market, watch for the %K line to cross below the %D line as a sell signal.
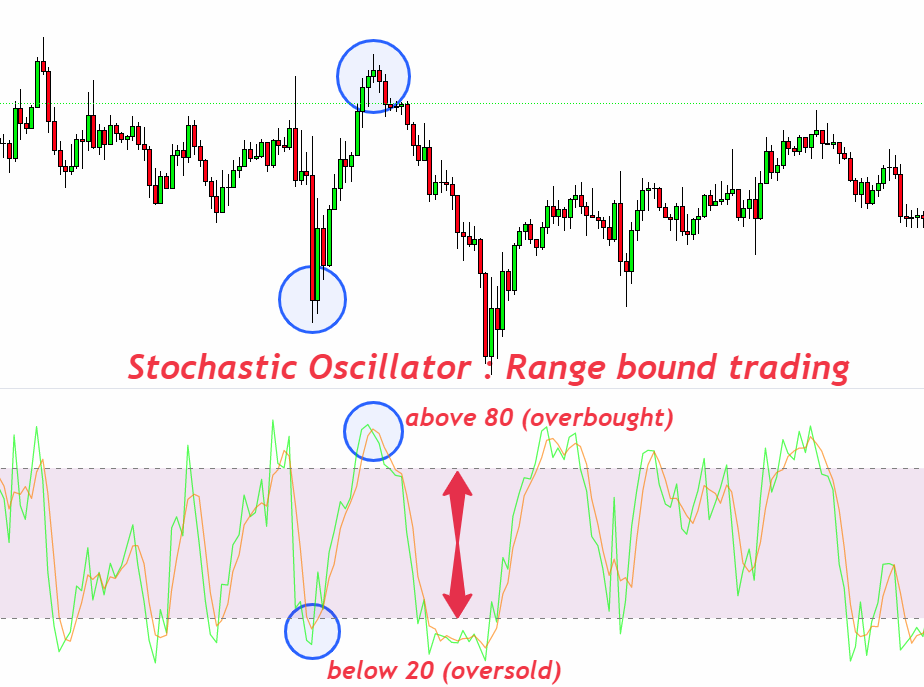
- Range Trading: In a ranging market, buy when the Stochastic moves above 20 from an oversold condition and sell when it moves below 80 from an overbought condition.
- Divergence Trading: Look for divergence between the Stochastic Oscillator and the price action as a sign of potential trend reversals. For example, if the price makes a new low but the Stochastic forms a higher low, it may indicate an upcoming bullish reversal.
Practical Tips for Traders
- Time Frame Sensitivity: Be aware that the Stochastic Oscillator can behave differently across time frames. Shorter time frames may generate more signals, but with higher noise levels. Longer time frames provide fewer, but potentially more reliable, signals.
- Signal Confirmation: Always wait for the current candle to close before considering a Stochastic signal confirmed, to avoid acting on what could be a false signal.
- Risk Management: Combine Stochastic signals with sound risk management practices. Set stop-loss orders to manage your risk on each trade, and don’t risk more than a small percentage of your trading capital on a single trade.
By applying the Stochastic Oscillator thoughtfully and in combination with other analysis tools and sound risk management, Forex traders can enhance their trading strategy and decision-making process.
Case Studies and Real-Life Applications
Incorporating case studies and real-life applications can significantly enrich the understanding of how the Stochastic Oscillator is used in Forex trading. Below are two hypothetical scenarios that illustrate the practical application of this tool in trading decisions.
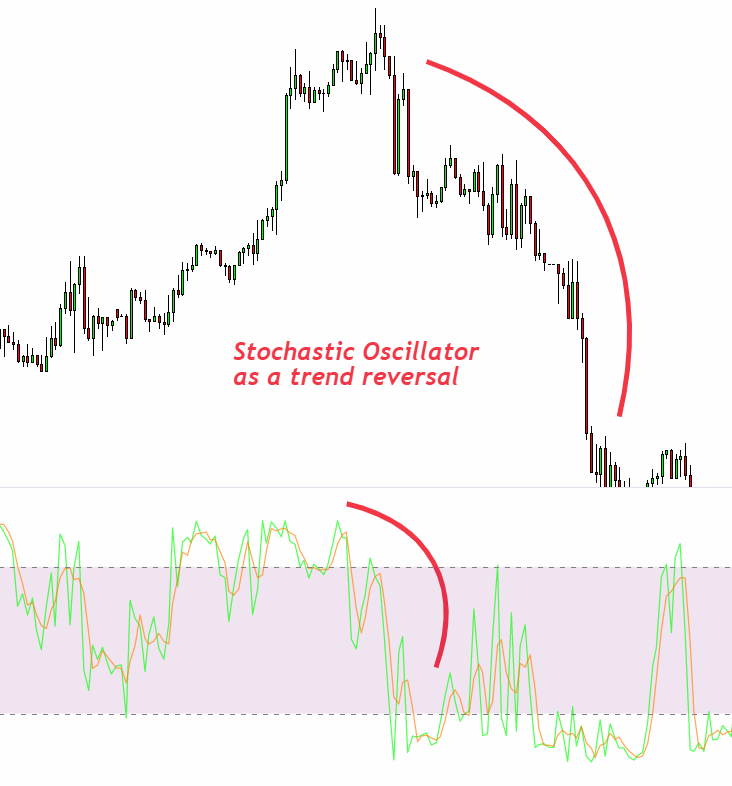
Case Study 1: Identifying a Trend Reversal in EUR/USD
Background: Assume the EUR/USD has been in a downtrend for several weeks. The Stochastic Oscillator has been lingering in the oversold region, indicating sustained selling pressure.
Scenario: During a trading session, the Stochastic Oscillator begins to show divergence; while the EUR/USD posts a new low, the Stochastic forms a higher low. This is a classic bullish divergence, suggesting weakening downward momentum.
Action: Observing the bullish divergence, a trader decides to enter a long position, betting on a potential upward reversal. The %K line crosses above the %D line within the oversold area, providing further confirmation.
Outcome: Following the entry, the EUR/USD starts to rally, confirming the trend reversal indicated by the Stochastic Oscillator. The trader monitors the Stochastic for signs of overbought conditions to plan an exit.
Lesson: This case highlights the effectiveness of using Stochastic divergence as an early warning of potential trend reversals, especially when confirmed by other signals.
Case Study 2: Capitalizing on Range-Bound Trading in USD/JPY
Background: The USD/JPY is experiencing a period of low volatility, moving within a defined range without a clear trend.
Scenario: The Stochastic Oscillator fluctuates between overbought and oversold levels, aligning closely with the currency pair’s price touching the range’s upper and lower boundaries.
Action: A trader uses the Stochastic Oscillator to trade within the range, selling when the Stochastic reaches the overbought territory (above 80) and buying when it falls into the oversold territory (below 20).
Outcome: The strategy proves profitable as the USD/JPY continues to bounce between the range’s limits. The trader uses Stochastic crossovers within these extreme regions as signals to enter and exit trades.
Lesson: This case illustrates how the Stochastic Oscillator can be an effective tool in range-bound markets, allowing traders to take advantage of price fluctuations within a defined range.
Real-Life Application: Combining Stochastic with Economic News
Scenario: A Forex trader combines Stochastic signals with economic news releases. For instance, if the Stochastic is in oversold territory and a key economic indicator for the USD comes out better than expected, the trader might anticipate bullish momentum for USD pairs and plan trades accordingly.
Outcome: By aligning technical signals from the Stochastic Oscillator with fundamental analysis, the trader can make more informed decisions, potentially leading to higher success rates in trades.
Lesson: This application underscores the importance of combining technical analysis with fundamental factors to enhance the robustness of trading decisions in the Forex market.
These case studies and real-life applications demonstrate the versatility of the Stochastic Oscillator in various market conditions and strategies, emphasizing the need for context, risk management, and complementary analysis tools in trading.
Conclusion
The Stochastic Oscillator is a powerful tool in Forex trading, offering valuable insights into market momentum and potential turning points in price movements. By highlighting overbought and oversold conditions, providing clear signals through crossovers, and indicating divergence, it helps traders identify possible entry and exit points, enhancing their trading strategy.
However, like all technical indicators, the Stochastic Oscillator is not infallible. Its effectiveness can be influenced by market volatility and it may produce false signals. Therefore, it’s crucial for traders to use it in conjunction with other analysis tools, such as trend indicators, support and resistance levels, and fundamental analysis, to validate signals and build a more comprehensive trading strategy.
Risk management is also key when trading with the Stochastic Oscillator. Traders should always set stop-loss orders to protect their capital from significant losses and avoid risking too much on a single trade. Adhering to a disciplined trading plan and continuously learning from both successful and unsuccessful trades is essential for long-term success in the Forex market.
In conclusion, the Stochastic Oscillator is a versatile and valuable indicator for Forex traders. When used wisely, in combination with other tools and sound risk management practices, it can significantly contribute to a trader’s ability to make informed decisions, manage risk, and capitalize on market opportunities.

