Definition
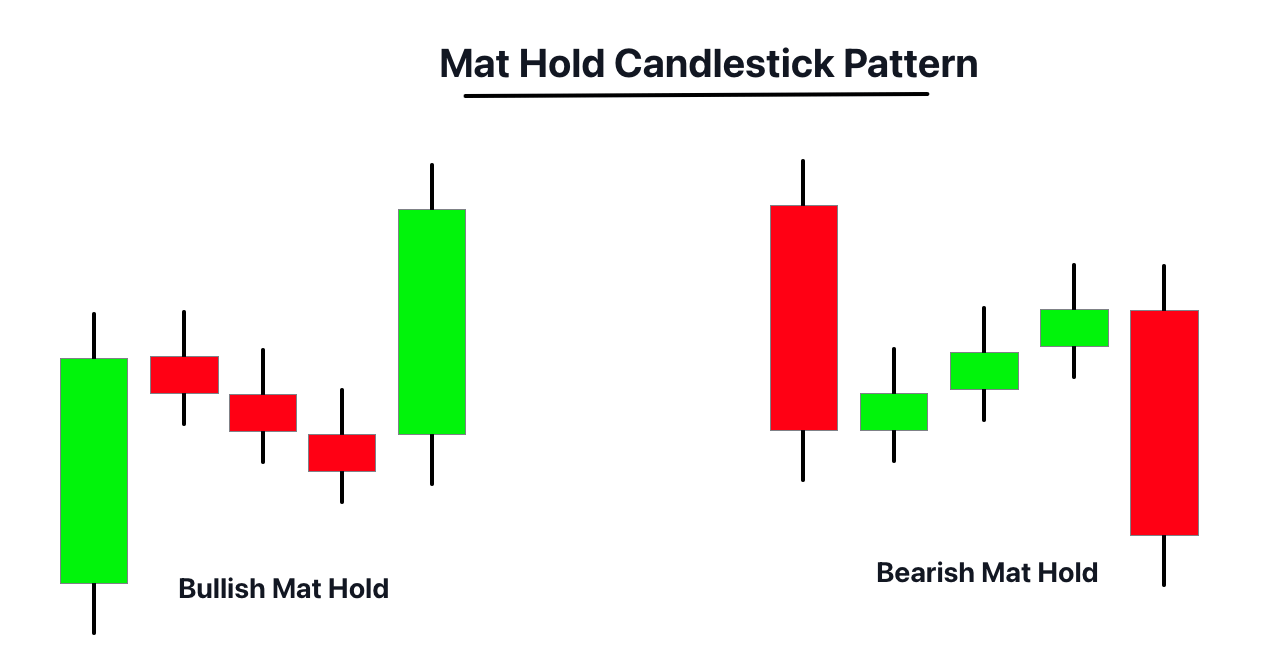
A Mat Hold Candlestick Pattern is a continuation pattern consisting of five candles, often signaling a bullish trend’s endurance, formed by a long bullish candle, followed by three smaller bearish or bullish candles contained within the range of the first candle, and concluded with a bullish candle.
The Mat Hold Candlestick pattern is a powerful tool employed by traders to predict the continuance of a bullish market trend. Recognizing this pattern within a well-established uptrend can provide a strategic edge in capturing potential profitable trades.
How to identify the Mat Hold Candlestick pattern?
Identifying the Mat Hold Candlestick Pattern on a chart involves understanding the structure and sequence of the five candlesticks that make up the pattern. Here’s how to spot it:
- Established Uptrend: The pattern should appear within a clearly defined uptrend. This uptrend represents the bullish sentiment in the market before the formation of the pattern.
- First Candle: The first candle in the sequence should be a long bullish candle. It establishes the high and low range for the next three candles.
- Three Inside Candles: The next three candles, which can be either bullish or bearish, should be formed within the range of the first bullish candle. They represent a period of consolidation or slight retracement in the market.
- Final Bullish Candle: The fifth and final candle should be a bullish one that closes above the close of the first candle, confirming the continuation of the uptrend.
Identifying this pattern involves understanding the sentiment in the market, gauging the price action, and paying attention to the shape and positioning of the individual candles within the pattern.
Significance
The Mat Hold candlestick pattern is a continuation pattern in an uptrend, which means it is a bullish signal. It indicates that the current uptrend is likely to continue, despite brief periods of consolidation or minor price retracements within the pattern. Here’s why it is significant:
- Continuation Indicator: The pattern indicates that the market sentiment remains bullish, and buyers are still in control, despite small periods of uncertainty represented by the three inside candles.
- Strong Uptrend Confirmation: The final bullish candle, which closes above the close of the first candle, provides strong confirmation that the uptrend is robust and likely to continue.
- Trading Opportunities: For traders, the formation of this pattern offers a good opportunity to enter or add to a bullish position, with the expectation of benefitting from the continuation of the uptrend.
Activity of big traders behind the chart
Understanding the activity of big traders when a Mat Hold pattern emerges on a chart can offer insight into market sentiment and future price behavior.
- Initial Bullish Control: The formation of the Mat Hold pattern begins with a strong bullish candle, which indicates that institutional traders and big market participants are driving the price upward.
- Consolidation Period: The next three days are generally characterized by smaller candles of either color, often forming a small trading range. During this time, large traders may be holding their positions and assessing the market’s direction, or they could be slowly accumulating more positions. This period also represents profit-taking by some early bulls and possible entry of contrarian traders.
- Reassertion of Bullish Momentum: The final candle is bullish and closes above the first candle’s high, showing that big traders have resumed their bullish activity, driving prices higher again. This could be due to positive market news, earnings reports, or simply the sentiment that the underlying asset is undervalued.
Confluences
The following table suggests tools and conditions that could confirm the high probability of a Mat Hold pattern:
| Tool/Condition | Description |
|---|---|
| Key Level | The pattern’s formation around significant support levels can provide stronger confirmation of its validity. |
| Volume | A spike in volume on the last bullish day of the pattern can indicate the resumption of a strong upward move. |
| Moving Averages | The pattern’s formation above key moving averages (like the 50-day or 200-day MA) can reinforce its bullish signal. |
| Oscillators | Bullish divergences on oscillators like RSI or Stochastic during the pattern’s formation can further confirm bullish sentiment. |
These tools and conditions should be used in combination, as relying on just one may lead to false signals. It’s also vital to consider the broader market context and any relevant news events.
Key Points
Best Timeframe: The Mat Hold pattern tends to be more reliable on higher timeframes such as the daily or weekly charts. These timeframes reduce the noise of the market and provide clearer patterns.
Trading Session: This pattern can be identified across any trading session; however, it’s crucial to align it with the most active session for the underlying asset. For instance, if you’re trading stocks, the pattern might be more relevant during the market’s open hours.
Winning Ratio: The Mat Hold is a relatively uncommon pattern and its winning ratio may vary based on market conditions and the trader’s proficiency in identifying the pattern. However, with proper risk management and confirmation techniques, a winning ratio around 60-65% could be feasible.
Trading Strategy with Mat Hold Pattern and Support/Resistance Confluence
- Identify the Pattern and Key Levels: Firstly, locate the Mat Hold pattern in a chart and identify the key support and resistance levels. The Mat Hold pattern is more reliable when it forms around these key levels.
- Confirmation of Support or Resistance: Wait for the price to test the identified key level. The support or resistance level is confirmed when the price bounces off it.
- Entry Point: The ideal entry point would be as soon as the price starts moving in the direction of the trend after forming the Mat Hold pattern and respecting the key level. For a bullish Mat Hold, this would be when the price starts to rise, and for a bearish one, when it starts to fall.
- Stop Loss: Set your stop loss slightly below the lowest point (for bullish trend) or above the highest point (for bearish trend) of the Mat Hold pattern. This ensures that your trade will be closed to limit losses if the price moves contrary to the expected direction.
- Take Profit: The take profit level can be set at the next key resistance level (for bullish trend) or support level (for bearish trend). Alternatively, traders may use a risk-reward ratio (like 1:2 or 1:3) to define the take-profit level.
The confluence of the Mat Hold pattern with key support or resistance levels can add to the effectiveness of the strategy, providing better trade entries and higher probability setups.
Conclusion
In conclusion, the Mat Hold candlestick pattern, like any other pattern, is a valuable tool in a trader’s toolkit, offering insights into possible future market direction. Recognizing this pattern and understanding its implications is critical for market timing and decision-making. The pattern’s effectiveness can be further enhanced by looking for its confluence with key support or resistance levels.

