Definition:
The Head and Shoulders pattern is a chart formation that predicts a bullish-to-bearish trend reversal, characterized by three peaks with the central peak (head) being the highest and the two outer peaks (shoulders) being nearly equal in height. A classic in technical analysis, the Head and Shoulders pattern signals potential market tops and trend reversals, often used by traders to time their entries and exits.
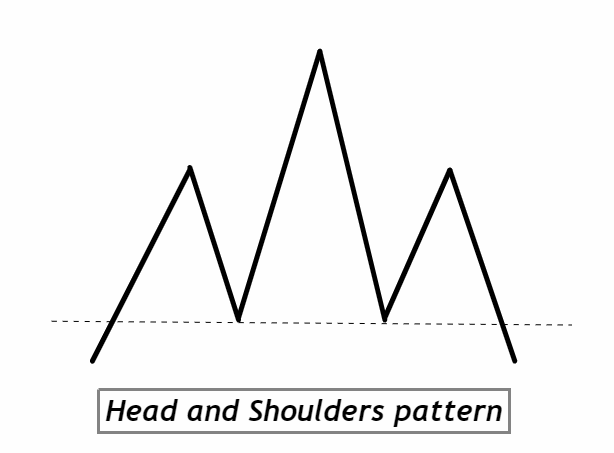
Identification of the Head and Shoulders pattern on a chart:
- Uptrend Preceding Formation: Before the pattern begins to form, there should be a noticeable uptrend in the market.
- Left Shoulder:
- Begins with a peak (top) followed by a decline.
- This peak will typically be lower than the head and roughly similar in height to the right shoulder.
- Head:
- After the left shoulder, there’s a price rise that surpasses the previous peak, creating the highest point of the pattern.
- This is followed by a decline back to a level similar to the one after the left shoulder.
- Right Shoulder:
- Another rise in price, but it doesn’t reach the height of the head. Instead, it forms a peak roughly equal in height to the left shoulder.
- This is followed by another decline.
- Neckline:
- Draw a line connecting the lows after each shoulder and the head.
- A decisive price break below the neckline signals the pattern’s completion and a potential bearish reversal.
- Volume Consideration:
- Typically, volume will decrease as the pattern progresses, with notable spikes during the formation of the head and the eventual breakout below the neckline.
- Symmetry:
- Ideally, the pattern should display some symmetry. This means that the left and right shoulders should be roughly similar in appearance and height. However, perfect symmetry is not always necessary for the pattern to be valid.
The significance and indications of the Head and Shoulders pattern from a professional trader’s perspective:
1. Signal for Trend Reversal:
At its core, the Head and Shoulders pattern is a trend-reversal indicator. Originating from an uptrend, its formation signals a potential shift from a bullish to a bearish market. For traders, recognizing this pattern means they can anticipate this shift, positioning themselves to capitalize on a downward movement.
2. Psychological Insight:
The pattern provides a window into the market’s psychology. The left shoulder and head represent bullish sentiment, with buyers pushing the price to new highs. However, their inability to maintain these highs, leading to the formation of the right shoulder, signifies diminishing bullish momentum. When the price breaks below the neckline, it confirms the bears have taken control, which can lead to a rapid sell-off.
3. Clear Entry and Exit Points:
One of the most beneficial aspects of this pattern for traders is its clarity in signaling potential entry and exit points. The break below the neckline serves as a definitive signal for traders to consider short positions, with the neckline then acting as a potential resistance level. This clarity helps reduce ambiguity in decision-making.
4. Measureable Price Targets:
Traders can also gauge potential price targets post-breakout. By measuring the distance from the neckline to the peak of the head and projecting this distance downward from the breakout point, traders get a rough estimate of how far the price might fall, aiding in risk management and setting profit targets.
For new traders, the Head and Shoulders pattern is a valuable tool in the arsenal. While it’s crucial to recognize it and understand its implications, one must always combine it with other analysis techniques and never rely on it in isolation.
Activities from a professional trader’s perspective:
1. Left Shoulder Creation:
During the formation of the left shoulder, institutional players often continue their buying activity, contributing to the ongoing uptrend. This initial peak represents optimism and the continuation of the prevailing bullish sentiment. Retail traders, seeing the strength, also typically join in, not wanting to miss further upside.
2. Head Formation:
The head’s peak sees heightened activity. Institutional traders may recognize the overextended nature of the asset and begin reducing their positions or taking profits. This distribution leads to the dip after the head. However, the sentiment is still not entirely bearish, and many may interpret the dip as a buying opportunity, leading to a brief resurgence in price.
3. Right Shoulder Development:
This is where the subtler games begin. As the price climbs again but fails to reach the head’s highs, savvy institutional traders might interpret this as a weakening of the bullish momentum. Their further distribution or even initiation of short positions intensifies the downward pressure. This activity is a key indicator of the diminishing confidence in the asset’s upward potential.
4. Neckline Break:
The break below the neckline can be seen as a culmination of the growing bearish sentiment among big players. Their significant selling pressure or increased shorting can lead to sharp downward moves. They understand that the break of the neckline is a clear signal, and many algorithmic trading systems used by institutions are designed to act upon such technical cues.
5. Post-Break Activities:
Once the neckline is breached, institutional traders might continue to press their advantage by adding to their short positions, further driving down prices. They may also use this period to accumulate assets at lower prices, especially if fundamentals support a longer-term bullish view.
For retail traders, it’s vital to recognize that large institutional movements often shape these patterns. While the chart provides the visual cue, the underlying story is one of shifting sentiment among the market’s most influential players. Tapping into this narrative can offer retail traders a more informed perspective and potentially better positioning within the market. Always remember, the smart money’s actions don’t just reflect the market; in many ways, they shape it.
High Probability Confirmation Tools for the Head and Shoulders Pattern
| Tool | Description |
|---|---|
| Key Level Break | A decisive break below a significant support level or the neckline serves as a strong confirmation of the pattern’s validity. |
| Low After Pattern | A break of the immediate low formed after the pattern (especially post-right shoulder) signifies increasing bearish momentum. |
| Volume Surge | A spike in volume during the neckline break is a potent indicator of strong participation, usually confirming the reversal. |
| Other Technical Indicators | Utilizing tools like the RSI (Relative Strength Index) can help gauge overbought or oversold conditions. An RSI reading moving below 50 at the time of a neckline break can further confirm bearish sentiment. |
By integrating these confirmation tools, traders can ensure a more robust and high-probability trading setup when identifying the Head and Shoulders pattern. Remember, multiple confluences generally lead to higher chances of a successful trade outcome.
Optimal Trading Conditions for the Head and Shoulders Pattern
Best Timeframe:
For enhanced reliability, the Daily (1D) timeframe is often preferred by professional traders. It captures the broader market sentiment and filters out the ‘noise’ seen in shorter timeframes.
Trading Session:
The pattern’s validation is most prominent during major market sessions like the New York or London sessions, where liquidity and participation are at their peak.
Winning Ratio:
While the Head and Shoulders pattern is known for its accuracy, it’s essential to understand that no pattern guarantees success. Typically, a well-executed Head and Shoulders strategy can offer a winning ratio of around 60-70%. However, combining it with other confluences can enhance its reliability.
Always ensure you manage your risk effectively, and remember that historical performance is not indicative of future results.
Head and Shoulders Trading Strategy with Confluence
1. Entry Point:
Wait for a clear break below the neckline. Once the break occurs, look for a small pullback or retest of the neckline from below. This retest is your optimal entry point. The retest isn’t always necessary, but when it occurs, it provides a higher probability setup.
2. Stop Loss:
Place the stop loss slightly above the right shoulder. This is a logical point because if the price goes beyond the right shoulder after the neckline break, it invalidates the pattern.
3. Take Profit Level:
Measure the vertical distance from the neckline to the head’s peak. Project that same distance downwards from the neckline break to set a target for potential profits. This gives an approximate idea of how far the price might move in the bearish direction after the pattern completion.
4. Adding Confluence:
To increase the reliability of the trade:
- Ensure the volume spikes on the neckline break, indicating strong market participation.
- Check if major support and resistance zones align with the pattern.
- Utilize indicators like RSI. For example, an RSI crossover below 50 can confirm bearish momentum.
Conclusion:
The Head and Shoulders pattern is a powerful tool for forecasting potential trend reversals, especially when combined with other confirming factors or confluences. While it provides a structured trading approach with clear entry, stop loss, and take profit guidelines, traders should always remain adaptable and continuously assess market conditions. As with all strategies, it’s imperative to manage risk effectively and combine technical insights with broader market awareness.

