Definition:
“Cup and Handle is a bullish technical pattern resembling a tea cup on a price chart, indicating potential for a breakout to new highs after a period of consolidation.” Originating in the stock market and popularized by William O’Neil, the Cup and Handle pattern serves as a powerful tool for traders forecasting bullish momentum.
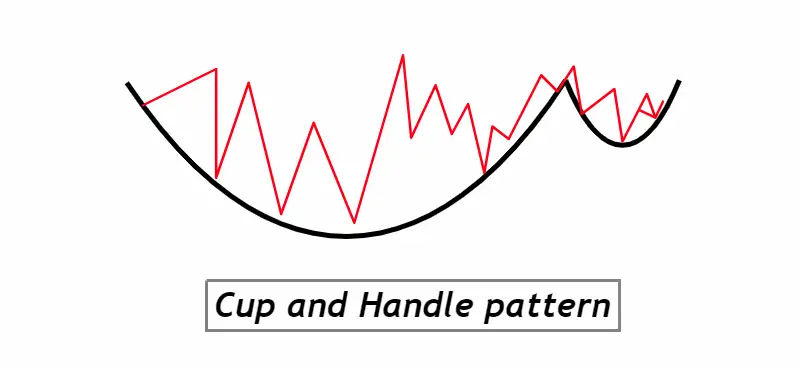
how to identify the Cup and Handle pattern on a chart:
- Prior Uptrend: Begin by identifying a preceding upward trend in price. This is important as the Cup and Handle is considered a continuation pattern, suggesting an onward move in the prior direction.
- The Cup:
- Rounded Bottom: The price forms a U-shaped or rounded bottom, resembling the base of a tea cup. The bottom should not be V-shaped.
- Equal Highs: The two peaks at the beginning and end of the cup should be roughly at the same price level, indicating resistance.
- Depth: Ideally, the depth of the cup should not be overly deep. A shallow cup suggests a more bullish scenario.
- Duration: The cup formation can take anywhere from a few weeks to several months to form.
- Handle Formation:
- Pullback: After the second peak of the cup, there’s a moderate pullback in price. This forms the handle.
- Duration: The handle is typically shorter in duration, ranging from a week to a few months.
- Volume: Volume usually contracts during the formation of the handle, suggesting decreased selling activity.
- Slope: A downward or sideways drift is more common, though a slight upward drift is also possible.
- Breakout:
- Volume Surge: A breakout from the handle’s resistance (upper trendline) should ideally be accompanied by a surge in volume, confirming the bullish sentiment.
- Resistance Level: The price should close above the resistance level marked by the peaks of the cup for a valid breakout.
- Retest (Optional): Sometimes, after a breakout, the price may retest the breakout level, providing a secondary entry point or confirmation of the breakout.
significance and implications of the Cup and Handle pattern from a trader’s perspective:
1. Continuation Signal: The Cup and Handle stands out primarily as a continuation pattern. It suggests that after a brief pause or consolidation in the market, the prevailing trend (usually bullish) is likely to resume. This is immensely valuable for traders as it provides them with an opportunity to enter or add to their existing positions, anticipating further upward movement.
2. Defined Entry and Exit Points: One of the primary strengths of the Cup and Handle pattern is its clear demarcation of entry and exit points. The breakout above the handle’s resistance level serves as a potent entry signal. Simultaneously, a drop back below the handle or the cup’s base can act as a stop-loss point, helping traders manage risk effectively. This clarity aids in objective decision-making, reducing emotional biases.
3. Volume Confirmation: Volume plays a pivotal role in the validation of this pattern. An increase in volume during the breakout phase serves as a confirmation of the bullish sentiment, making the pattern more reliable. Conversely, a breakout without significant volume might be treated with caution. This emphasis on volume helps traders gauge the strength of the potential move and the conviction of the market participants.
4. Predictable Price Targets: The Cup and Handle also offers traders the ability to set a price target. By measuring the depth of the cup and projecting that distance from the breakout point, traders can establish a potential target, optimizing reward scenarios. Having a clear target aids in position management and profit-taking strategies.
In summary, the Cup and Handle pattern is cherished by traders for its ability to offer clear signals, defined risk parameters, and objective price targets, making it an essential tool in a trader’s arsenal.
The activity of big traders
the activity and behavior of institutional or “big” traders is paramount when dissecting the mechanics behind the Cup and Handle pattern. Here’s an insight into their activities:
1. Accumulation Phase: The formation of the cup, especially its base, is often seen as a phase of accumulation by big traders. While retail traders might perceive the initial decline (forming the left side of the cup) as a bearish signal, astute institutional players often view it as an opportunity to accumulate positions at a discounted price. Their buying activity at these lower levels provides the necessary support to halt a further decline, resulting in the rounded bottom of the cup.
2. Testing Resistance: As the price begins to rally, forming the right side of the cup, institutional participation is vital. Their sustained buying pushes prices to the prior resistance level (the starting point of the cup). However, this level might still have lingering supply or selling pressure, perhaps from retail traders who are looking to break-even or from those who perceive it as a potential double-top scenario.
3. The Handle’s Consolidation: This is a crucial phase for big traders. The handle, with its mild pullback, is emblematic of the last vestiges of selling pressure being absorbed. Institutional traders are not dumping their positions; instead, they are often using this phase to add more to their accumulation, ensuring that the breakout, when it happens, is robust and sustainable.
4. The Breakout: The breakout above the handle’s resistance is often fueled by significant institutional buying. By this phase, the big traders have gauged the market’s sentiment and are confident of a continued uptrend. Their hefty orders provide the momentum for the breakout, and this is usually accompanied by a noticeable spike in volume. Retail traders, recognizing this surge, often jump in, further propelling the price upward.
In essence, the Cup and Handle pattern is a dance between supply and demand, fear and greed. For the discerning retail trader, recognizing the silent moves of the institutional behemoths can offer an edge. When one understands the maneuvers of these market whales, they can more effectively position themselves to ride the same waves, rather than being swept away by them.
Confirmation Tools for the Cup and Handle Pattern
| Tool | Significance |
|---|---|
| Key Resistance Level | A clear resistance level at the lip of the cup provides a benchmark for the breakout. A strong close above this level, particularly on high volume, can confirm the pattern’s bullish implication. |
| Break of Handle’s Low | If, after the handle is formed, the price doesn’t break below the handle’s low, it indicates sustained buying interest and strength in the pattern. A break below could suggest weakness or potential pattern failure. |
| Volume Analysis | A surge in volume during the breakout phase is a strong confirmation of the pattern. Conversely, decreasing volume during the formation of the handle suggests selling exhaustion, further confirming the pattern’s strength. |
| Complementary Indicators | Incorporating technical indicators like the Relative Strength Index (RSI) or Moving Averages can provide additional confirmation. For instance, an RSI moving above 70 during the breakout could signify strong momentum. |
These tools, when used in tandem with the Cup and Handle pattern, can substantially increase the reliability of the setup, offering traders a higher probability scenario for their trading decisions.
Optimal Conditions for the Cup and Handle Pattern
Best Timeframe: The Daily and Weekly charts are most suitable for the Cup and Handle pattern. These timeframes filter out the ‘noise’ seen on lower timeframes, providing more reliable and clear pattern formations.
Trading Session: For global markets like forex, the overlap between the London and New York sessions (around 8 AM – 12 PM EST) often brings the highest liquidity and volume, making it a prime time to spot and trade the pattern.
Winning Ratio: While the Cup and Handle is a robust pattern, no setup is foolproof. Depending on its identification and other market conditions, a trader can expect a winning ratio of approximately 65-75% with this pattern when used in conjunction with other confirmation tools.
Cup and Handle Trading Strategy with Confluence
1. Confluence Factors:
- Trend Alignment: Ensure the prevailing trend prior to the pattern is bullish, aligning with the continuation nature of the Cup and Handle.
- Key Support/Resistance: Check for historical support or resistance levels around the lip of the cup. This can add weight to the breakout’s significance.
- Volume: As mentioned previously, a volume surge during the breakout provides added confirmation. Similarly, decreasing volume during the handle’s formation indicates selling exhaustion.
- Technical Indicators: Use tools like the RSI or Moving Averages to add an extra layer of validation. For instance, an RSI breaking above 70 during the breakout can signify strong momentum.
2. Entry: Initiate a long position once the price clearly breaks and closes above the resistance level of the handle, especially if this is accompanied by a volume surge.
3. Stop-Loss: Place the stop-loss just below the low of the handle. This ensures that you’re protected if the pattern fails and the price reverses. If the handle has a significant depth, consider a stop below the mid-point of the handle for a more conservative approach.
4. Take Profit Level: The most common method to determine a target is to measure the depth of the cup and project that distance from the breakout point. However, always be mindful of major resistance levels ahead, which can act as potential profit-taking zones.
Conclusion:
The Cup and Handle pattern, steeped in the dynamics of market psychology, offers traders a systematic approach to capitalizing on continuation moves. When enriched with confluence factors, this strategy’s reliability increases, positioning the trader for higher probability outcomes. However, as with all trading strategies, it’s essential to combine it with sound risk management practices. The beauty of the Cup and Handle lies not just in its visual simplicity, but in the depth of market insight it encapsulates.

