Definition
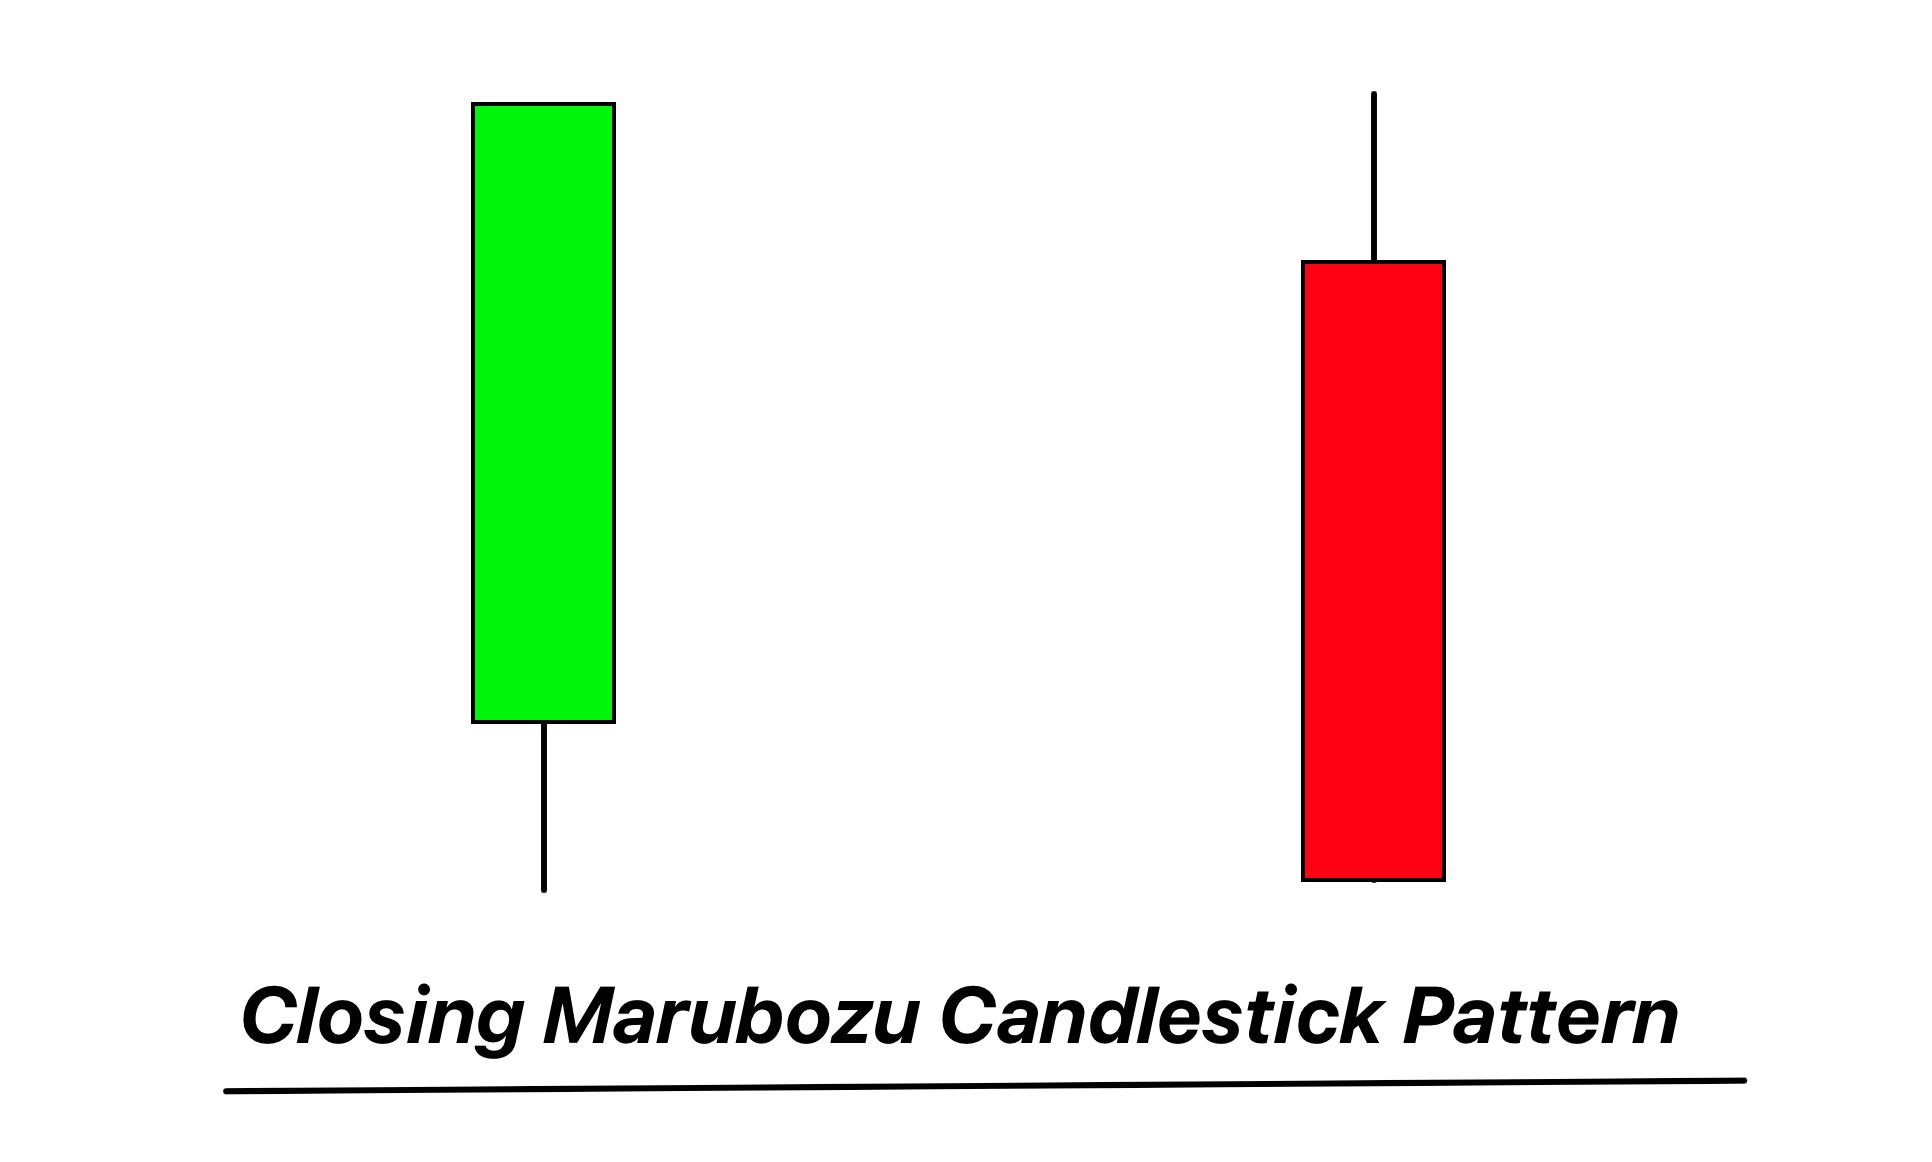
A Closing Marubozu is a single candlestick pattern characterized by a long body with no upper shadow and a short or non-existent lower shadow, indicating strong buying pressure or bullish sentiment when formed in a downtrend.
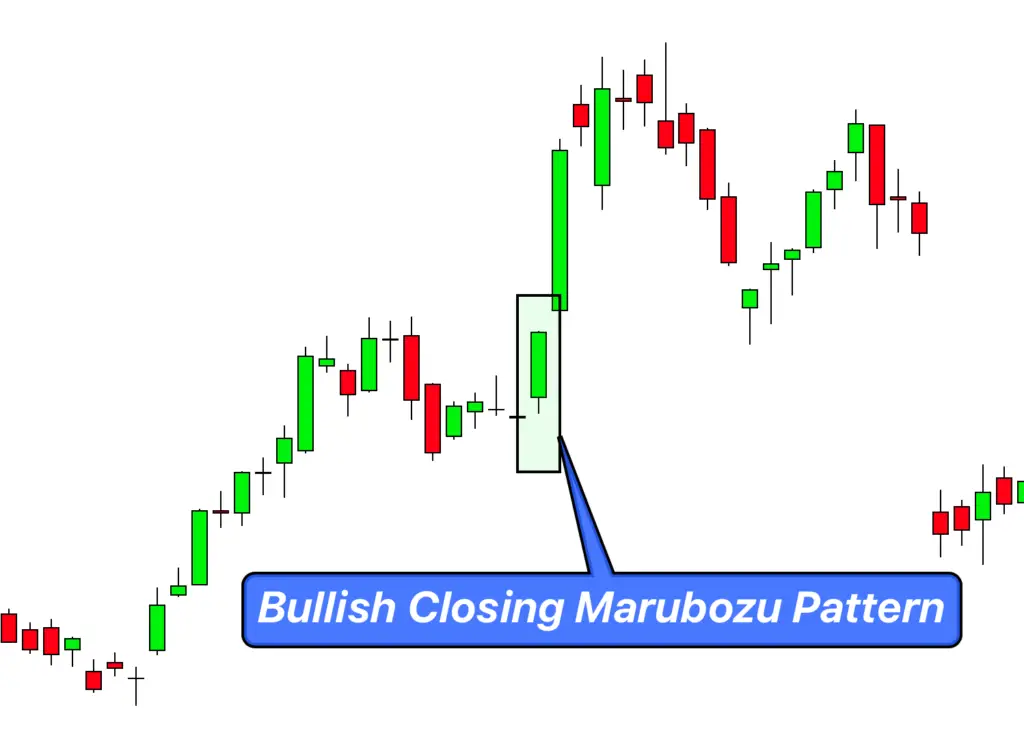
In the art of financial charting, the Closing Marubozu, often observed at the end of a price downtrend, is considered a potent signal of a possible bullish reversal, reflecting the dominance of buyers throughout the trading session.
Identifying the Closing Marubozu
To accurately spot a Closing Marubozu on a chart, traders should follow these steps:
- Body Length: First, look for a candlestick with a long body. This indicates a significant difference between the opening and closing prices.
- Upper Shadow: A true Closing Marubozu will have no upper shadow, indicating that the closing price is the highest price for that time period.
- Lower Shadow: The lower shadow, if any, should be very short. This indicates that the lowest price isn’t far from the opening price.
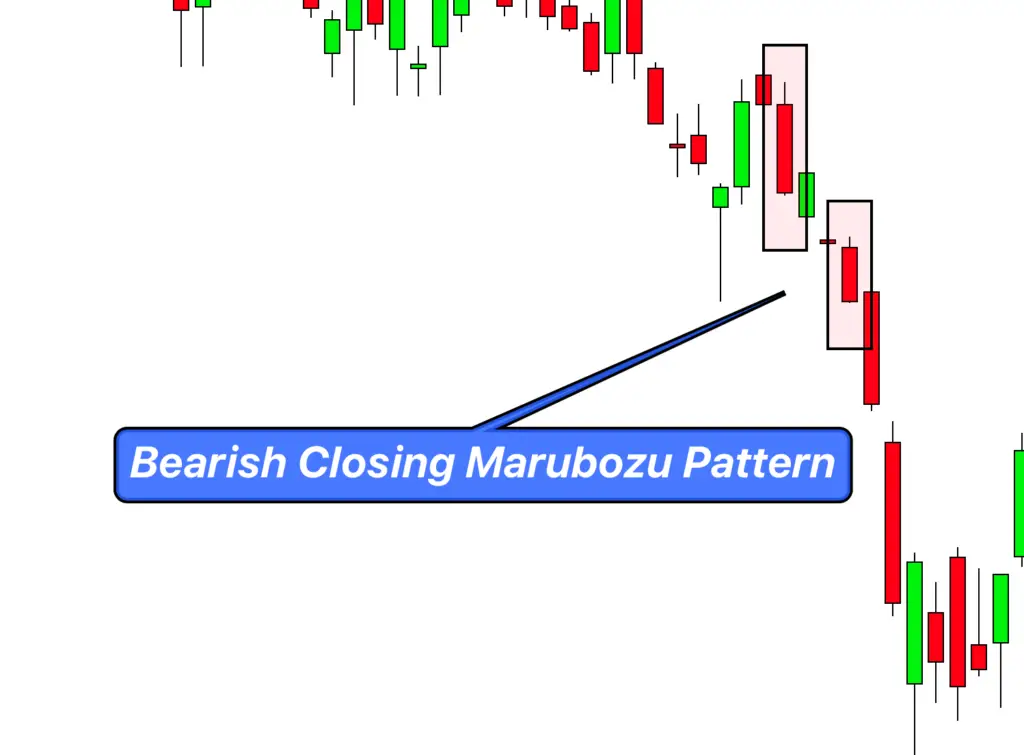
- Market Trend: It’s crucial to identify this pattern in the context of market trends. A Closing Marubozu is particularly significant if it appears at the end of a downtrend as it could signify a potential bullish reversal.
- Color: Lastly, a Closing Marubozu is generally a bullish pattern, so the color of the candlestick body should be green (or white, depending on your chart settings) signifying the closing price was higher than the opening price.
The Significance and Implications
The Closing Marubozu holds considerable weight in the technical analysis world due to its vivid display of market sentiment. It represents an almost entirely one-sided trading period where buyers controlled the price action from the opening bell to the closing bell, pushing prices up throughout the session.
The pattern typically emerges at the end of a downtrend and can indicate a potential bullish reversal. This strong bullish signal is an indication that buyers have not only gained control but have managed to maintain it throughout the entire trading period, suggesting a strong buying pressure.
The appearance of a Closing Marubozu often prompts traders to consider entering long positions or exiting short positions, anticipating a shift in trend direction.
Big Traders’ Activity During the Formation of a Closing Marubozu
When a Closing Marubozu forms, it suggests that big traders – institutional investors and hedge funds – are driving the price up, maintaining their buying pressure from the beginning to the end of the trading period. Their continuous buying activity throughout the session leaves no room for a price pullback, which is why there is no upper wick and a very small or non-existent lower wick in this pattern.
The formation of this pattern can be seen as a clear sign that these major market participants have a bullish outlook on the asset. This continuous buying not only drives the current price up but also sets the tone for future price action.
For retail traders, the emergence of a Closing Marubozu is an important cue to observe. If this pattern appears at the end of a downtrend, it may indicate a change in sentiment among big traders from bearish to bullish. It could be a sign that large traders are starting to accumulate the asset, potentially driving prices higher in the future.
However, retail traders must approach this pattern with caution. Large traders may also use such distinctive patterns to trigger a sentiment change and then take advantage of the subsequent price movements.
Confirmation Tools
When a Closing Marubozu candlestick pattern is identified, it’s crucial to seek additional confirmation before acting on this signal. Here are four tools that could provide the necessary validation:
- Key Level: Observe if the pattern has formed near a key level of support or resistance. If it forms at a support level, this provides an additional level of confirmation that the trend could reverse.
- Break of High After Pattern Formation: If the price breaks above the high of the Closing Marubozu in the subsequent trading period, it can further confirm the bullish sentiment.
- High Trading Volume: Increased trading volume during the formation of a Closing Marubozu can indicate a strong conviction in the change of sentiment. High volume gives more credibility to the potential reversal.
- Technical Indicators: Use technical indicators such as Moving Averages, RSI, or MACD. For instance, a bullish crossover in the MACD or a move above 30 in the RSI, in conjunction with the Closing Marubozu, can act as strong confirmation of bullish reversal.
Optimal Conditions
Best Timeframe: The Closing Marubozu can be identified on any timeframe, but it tends to be more reliable on longer timeframes such as the daily, weekly, or monthly chart. Longer timeframes often filter out the ‘noise’ of shorter periods, providing a clearer view of the market sentiment.
Trading Session: While it can form in any trading session, the pattern holds significant implications when it forms during high liquidity sessions, like the New York-London overlap for Forex or the first and last hours of the stock market trading day, as they better capture the overall market sentiment.
Winning Ratio: The precise winning ratio can vary based on a multitude of factors, including the market being traded and the trader’s overall strategy. However, if traded correctly with proper risk management and confirmation, it’s reasonable to expect a winning ratio of around 60-65%.
Trading Strategy with Confluence for Closing Marubozu
Entry: Once a Closing Marubozu is identified at the end of a downtrend and is confirmed by the factors mentioned earlier (key levels, break of high, high volume, and supportive technical indicators), the next step is to plan the entry. A conservative entry point could be set at the break of the high of the Closing Marubozu candlestick on the next trading period.
Stop-Loss: The stop-loss can be set just below the low of the Closing Marubozu candlestick. This level represents a price where the market has previously found strong buying pressure. If the price were to fall below this level, it might indicate that the expected bullish reversal may not occur.
Take-Profit: The take-profit level can be set at the next significant resistance level. If there are no clear resistance levels in sight, technical indicators like Fibonacci extensions or pivot points can be used to project potential targets.
Conclusion
The Closing Marubozu is a powerful candlestick pattern that displays a strong buying pressure or bullish sentiment, particularly when it appears at the end of a downtrend. As with any trading strategy, this pattern should be used in conjunction with other forms of technical analysis to confirm signals and increase the probability of successful trades. This pattern can help traders predict potential market reversals and formulate effective trading strategies.

