Introduction
Definition
The Butterfly Pattern is a sophisticated harmonic chart pattern renowned for its precision and reliability in identifying potential reversal zones. This pattern is distinguished by its distinct structure, which is defined by specific Fibonacci ratios. Traders across various markets use the Butterfly Pattern to forecast potential price reversals, making it a valuable tool in technical analysis.
Origin and Significance
- Development: The Butterfly Pattern was developed by Bryce Gilmore and later refined by Scott Carney, who established the critical Fibonacci ratios that define this pattern. It is a part of the harmonic pattern family, which includes other well-known patterns like the Gartley and Crab patterns.
- Importance in Technical Analysis: The Butterfly Pattern has gained a significant place in technical analysis due to its high degree of accuracy in predicting price reversals. Its structure, based on natural and mathematical harmony, resonates well with the ebb and flow observed in financial markets. This pattern is especially popular among traders who focus on harmonic trading methods.
- Utility: The pattern’s ability to identify potential reversal points with a high degree of precision makes it an invaluable tool for traders. Its integration of Fibonacci ratios offers a systematic and structured approach to market analysis, enabling traders to make well-informed decisions.
The Butterfly Pattern’s importance in trading stems from its effectiveness in capturing significant market turns, which can lead to profitable trading opportunities.
Structure of the Butterfly Pattern
Composition
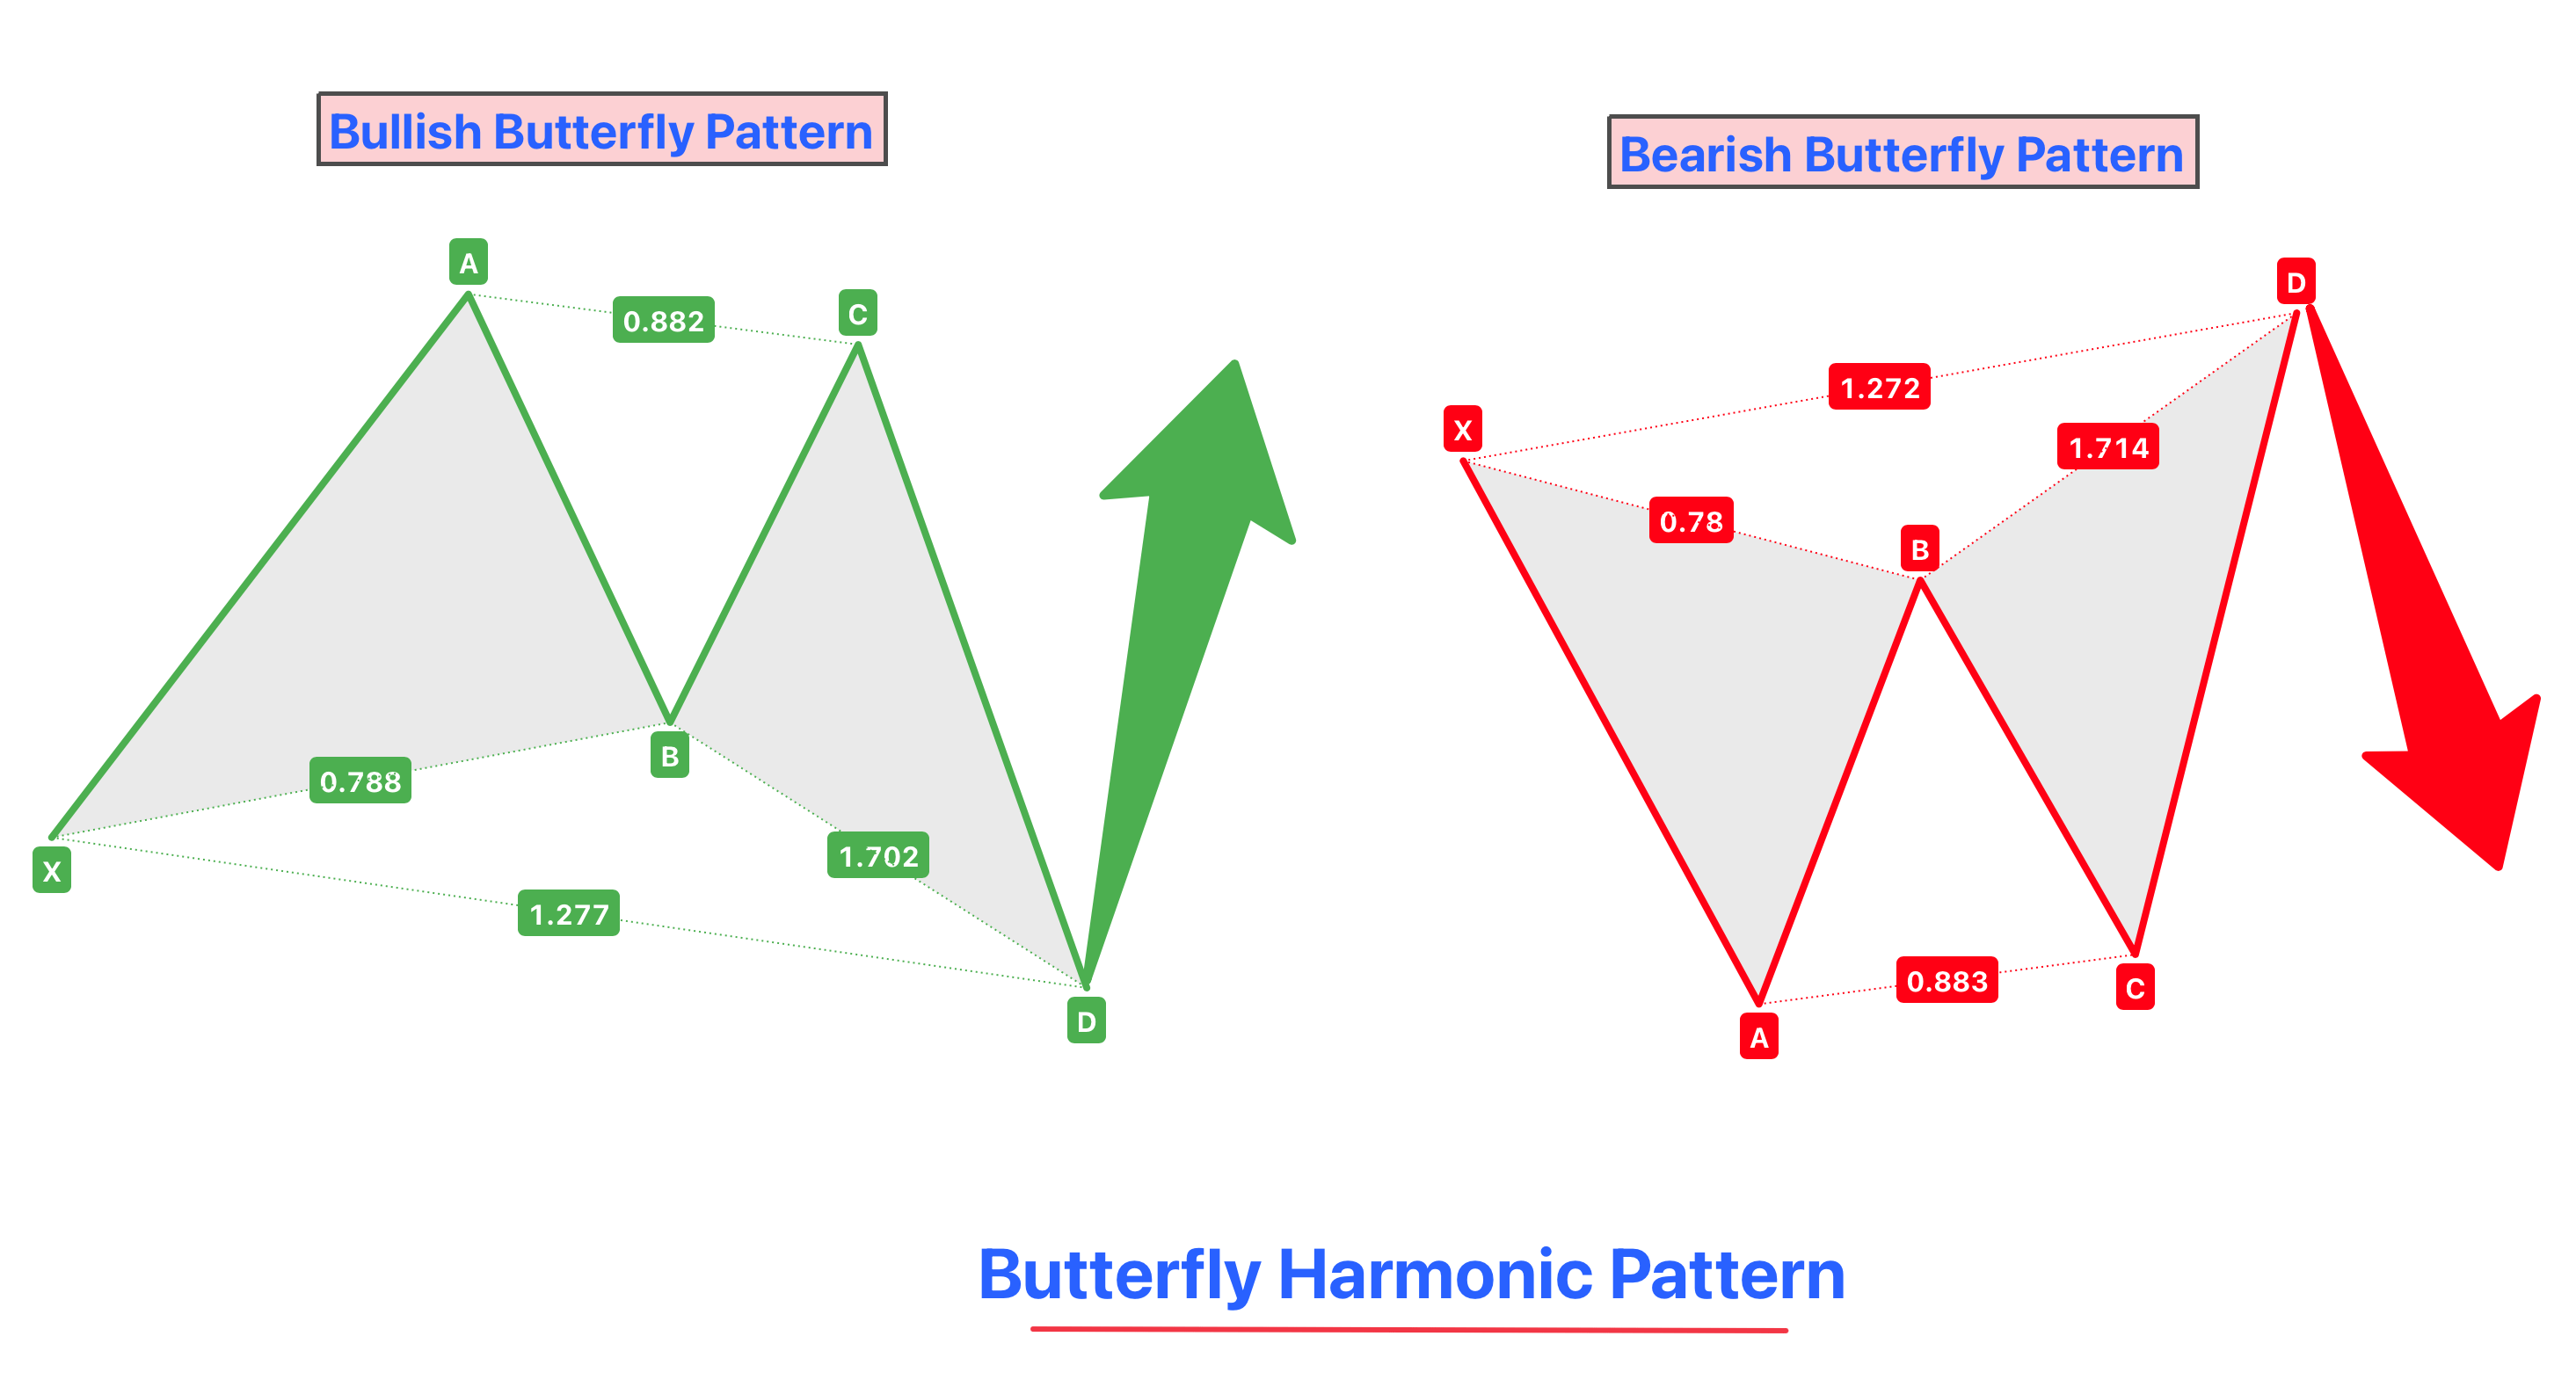
The Butterfly Pattern is composed of four crucial legs – XA, AB, BC, and CD – each characterized by specific Fibonacci relationships:
- XA Leg: This is the initial leg of the pattern, setting the stage for subsequent movements.
- AB Leg: The AB leg retraces approximately 78.6% of the XA leg, a key ratio for the Butterfly Pattern.
- BC Leg: This leg retraces anywhere between 38.2% and 88.6% of the AB leg.
- CD Leg: The final and most significant leg of the pattern, the CD leg extends to 161.8% to 261.8% of the AB leg and also retraces 127.2% to 161.8% of the XA leg.
Distinguishing Features
Several features distinguish the Butterfly Pattern from other harmonic patterns:
- Deep Retracement in AB Leg: The 78.6% retracement of the XA leg by the AB leg is a deeper retracement than seen in most other harmonic patterns, making it a unique feature of the Butterfly Pattern.
- Extended CD Leg: The CD leg of the Butterfly Pattern is typically much longer than the other legs, extending well beyond the initial XA leg. This extension is a critical aspect of the pattern, as it indicates a potential area for a strong reversal.
- Specific Fibonacci Ratios: The precise Fibonacci ratios associated with the Butterfly Pattern, particularly in the CD leg, are crucial for its identification and effectiveness. These ratios help in distinguishing the Butterfly Pattern from similar formations like the Gartley or the Crab patterns.
The structure of the Butterfly Pattern, defined by these unique Fibonacci relationships and characteristics, makes it a powerful tool in harmonic trading.
Identifying the Butterfly Pattern
Key Characteristics
To accurately identify the Butterfly Pattern, traders must be aware of specific criteria and Fibonacci ratios:
- XA Leg: The initial movement, which can be either up or down, sets the stage for the pattern.
- AB Leg: Must retrace to 78.6% of the XA leg, a unique and defining characteristic of the Butterfly Pattern.
- BC Leg: This leg retraces between 38.2% and 88.6% of the AB leg, adding flexibility to the pattern’s formation.
- CD Leg: The most critical leg, extending to between 161.8% and 261.8% of the AB leg. Additionally, it should retrace between 127.2% and 161.8% of the XA leg. This extended leg is what typically signals the reversal point in the market.
Bullish vs. Bearish Patterns
The Butterfly Pattern can appear as both bullish and bearish variations, each indicating potential reversals in different market trends:
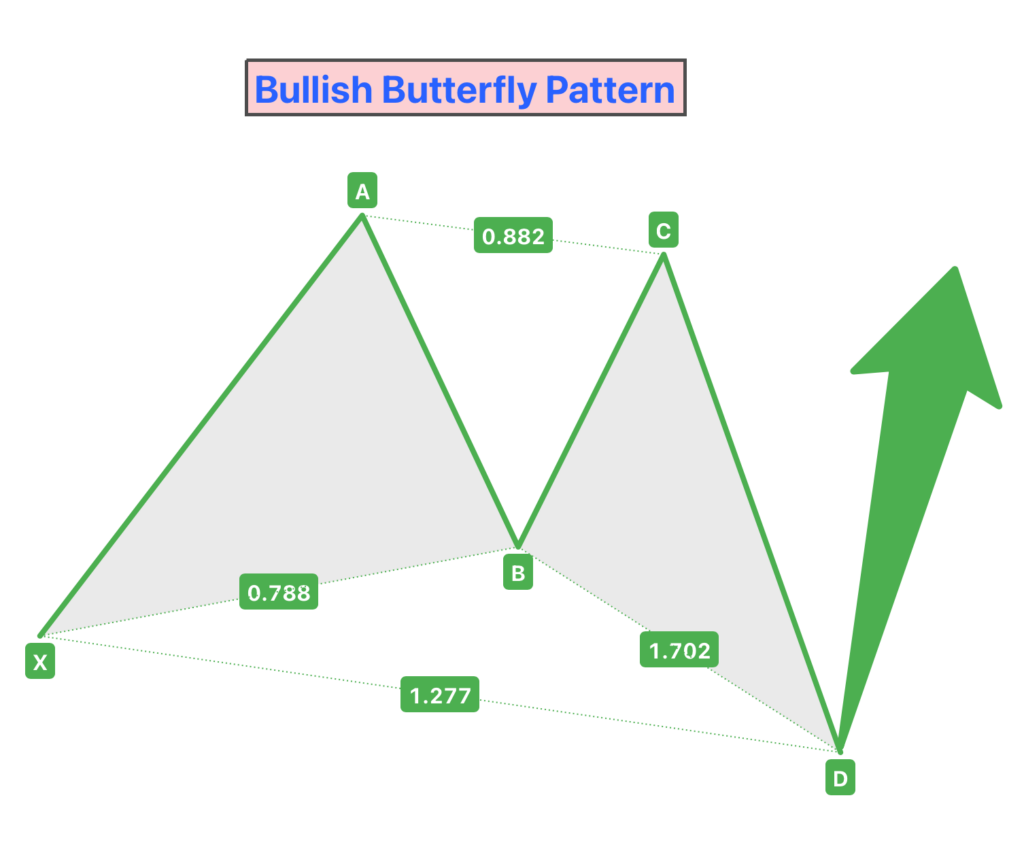
Bullish Butterfly Pattern
- Forms during a downtrend.
- Characterized by an initial downward XA leg, followed by a series of retracements and a final upward CD leg that extends significantly.
- The completion of the CD leg (at the high Fibonacci extension) indicates a potential bullish reversal, where traders might look for buying opportunities.
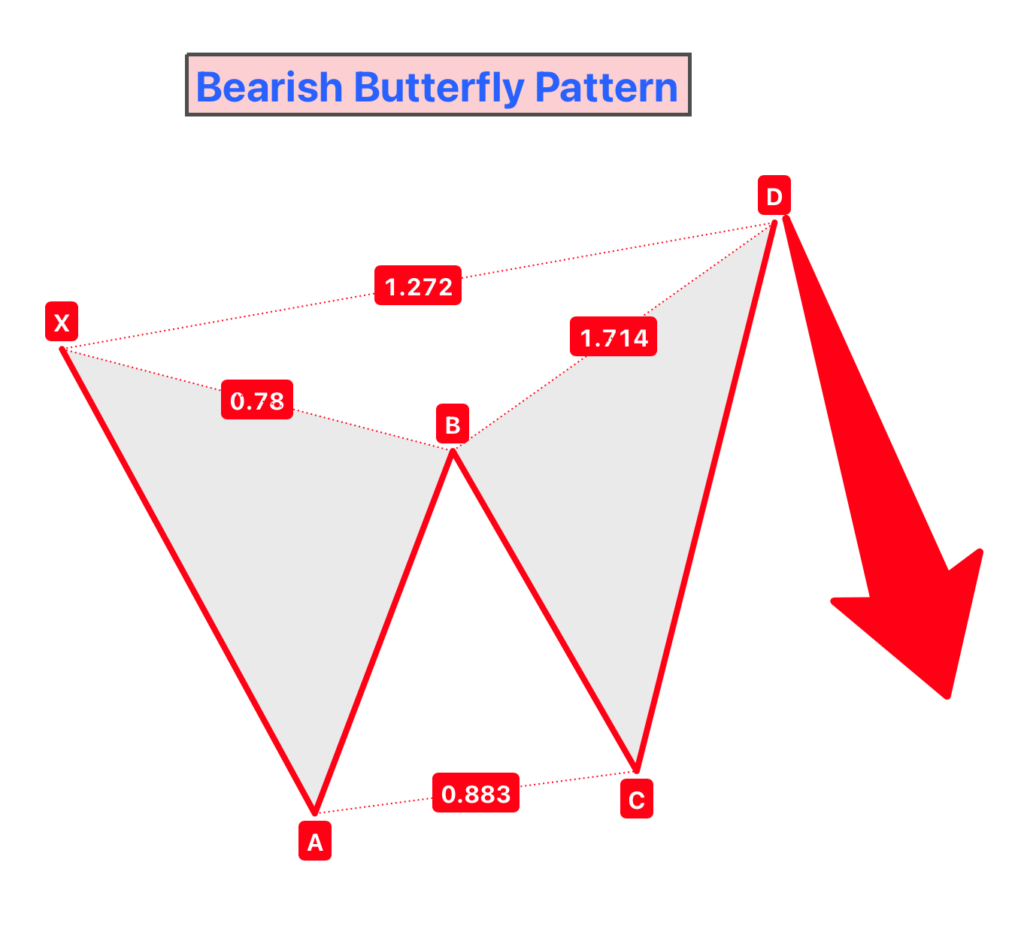
Bearish Butterfly Pattern
- Develops during an uptrend.
- Begins with an upward XA leg, followed by retracements and a downward extended CD leg.
- The pattern completes at the lower end of the CD leg, suggesting a potential bearish reversal and an opportunity for short selling.
In both cases, the specific Fibonacci ratios and the extended nature of the CD leg are crucial for correctly identifying the Butterfly Pattern.
Trading Strategies with the Butterfly Pattern
Entry Points
The completion of the CD leg in the Butterfly Pattern is pivotal for determining optimal entry points. This point signifies where the market is expected to reverse, making it an opportune moment for entering a trade.
- Bullish Butterfly Pattern: In a bullish setup, traders typically enter a long position (buy) at the completion of the extended CD leg. This is often at the low point where the pattern completes and a reversal is anticipated.
- Bearish Butterfly Pattern: For a bearish pattern, the entry point for a short position (sell) is at the completion of the CD leg, typically at the high point of the pattern.
Stop Loss and Profit Targets
Properly setting stop losses and profit targets is essential to manage risk and ensure potential profitability when trading the Butterfly Pattern.
- Stop Loss:
- Bullish Pattern: Place the stop loss slightly below the lowest point of the CD leg to protect against unexpected downward moves.
- Bearish Pattern: Set the stop loss just above the highest point of the CD leg to safeguard against a sudden upward price swing.
- The stop loss should be positioned where the pattern would be invalidated, indicating that the expected reversal is not occurring.
- Profit Targets:
- Profit targets are usually set based on the Fibonacci retracement levels of the CD leg or the entire pattern.
- A common strategy is to take partial profits at different Fibonacci retracement levels (such as 38.2%, 61.8%) of the CD leg.
- Traders may also look at previous support and resistance levels, as well as structure levels identified in the price chart, to set logical profit targets.
Trading the Butterfly Pattern requires a clear understanding of its structure and Fibonacci levels.
The Role of Fibonacci in the Butterfly Pattern
Importance of Ratios
Fibonacci ratios are crucial in the formation of the Butterfly Pattern, serving as the backbone for its structure. These ratios not only define the shape of the pattern but also its potential reversal points, making them indispensable in harmonic trading.
- Structural Accuracy: The specific Fibonacci ratios ensure the accuracy of the Butterfly Pattern’s formation. Each leg of the pattern conforms to a predetermined Fibonacci ratio, which is essential for validating the pattern.
- Predictive Power: These ratios enhance the pattern’s ability to predict market reversals. The precise retracement and extension levels determined by Fibonacci calculations indicate potential areas where the market is likely to turn.
Practical Application
Successfully applying the Butterfly Pattern in trading involves using Fibonacci tools to identify and confirm the formation of the pattern:
- Fibonacci Retracement Tool:
- This tool is used to measure the retracements of the AB and BC legs against the initial XA leg. For instance, ensuring that the AB leg retraces to exactly 78.6% of the XA leg is a key step in identifying the pattern.
- The completion of the CD leg should be measured using the Fibonacci retracement tool from X to A, checking for the 127.2% to 161.8% retracement level.
- Fibonacci Extension Tool:
- This tool helps in determining the extension of the CD leg. The CD leg should extend to 161.8% to 261.8% of the AB leg, a vital criterion for the pattern.
Utilizing these Fibonacci tools not only helps in accurately spotting the Butterfly Pattern but also in confirming its completion and potential reversal zones.
Combining the Butterfly Pattern with Other Technical Tools
Complementary Analysis
Enhancing the effectiveness of the Butterfly Pattern involves integrating it with other technical indicators and tools. This multifaceted approach leads to stronger and more reliable trading signals.
- Oscillators and Indicators:
- Tools like RSI (Relative Strength Index), MACD (Moving Average Convergence Divergence), and Stochastics can provide additional insights. For instance, an oversold condition on the RSI at the completion of the Butterfly Pattern can reinforce a potential bullish reversal.
- Volume indicators can also be valuable, as an increase in volume at the pattern’s completion point can confirm the strength of the reversal.
- Candlestick Patterns:
- Pairing candlestick patterns with the completion of the Butterfly Pattern can offer extra confirmation. Bullish or bearish engulfing patterns, doji, or hammers at the reversal point can strengthen the trade signal.
Market Context
Considering the overall market context and trends is vital when trading with the Butterfly Pattern:
- Trend Analysis:
- Understanding the prevailing market trend is crucial. The Butterfly Pattern often signals a reversal, but its effectiveness can be influenced by the strength of the underlying trend.
- In strong trending markets, the pattern may indicate a temporary retracement rather than a full reversal.
- Alignment with Market Phases:
- The pattern should be aligned with different market phases, whether in accumulation, distribution, advancement, or decline. This alignment ensures that the pattern is in sync with broader market dynamics.
- Support and Resistance Levels:
- Aligning the Butterfly Pattern with key support and resistance levels can provide additional validation for the pattern. These levels can act as potential targets or reversal points in line with the pattern’s predictions.
Conclusion
In conclusion, the Butterfly Pattern is a valuable tool in the harmonic trading approach, known for its precise Fibonacci ratios and potential to identify key reversal points. Its effectiveness is greatly enhanced when combined with other technical analysis tools, such as oscillators, volume indicators, and candlestick patterns, providing a more comprehensive and reliable trading strategy. However, it’s essential to consider the overall market context and align the pattern with prevailing trends and key market levels.

