Definition
The Gartley Pattern is a highly regarded and complex harmonic chart pattern in the world of trading. It is distinguished by its use of specific Fibonacci ratios to predict potential reversal points in the market. The Gartley Pattern is composed of consecutive price swings and retracements, which create a distinct and recognizable shape on the price chart.
This pattern is named after Harold McKinley Gartley, who first introduced it in his 1935 book, “Profits in the Stock Market.” Gartley’s work laid the foundation for the use of harmonic patterns in financial markets, making a significant contribution to the field of technical analysis. The Gartley Pattern, often referred to as the ‘222’ pattern in his book, has since evolved, incorporating Fibonacci ratios to enhance its accuracy and reliability.
Structure of the Gartley Pattern
Composition
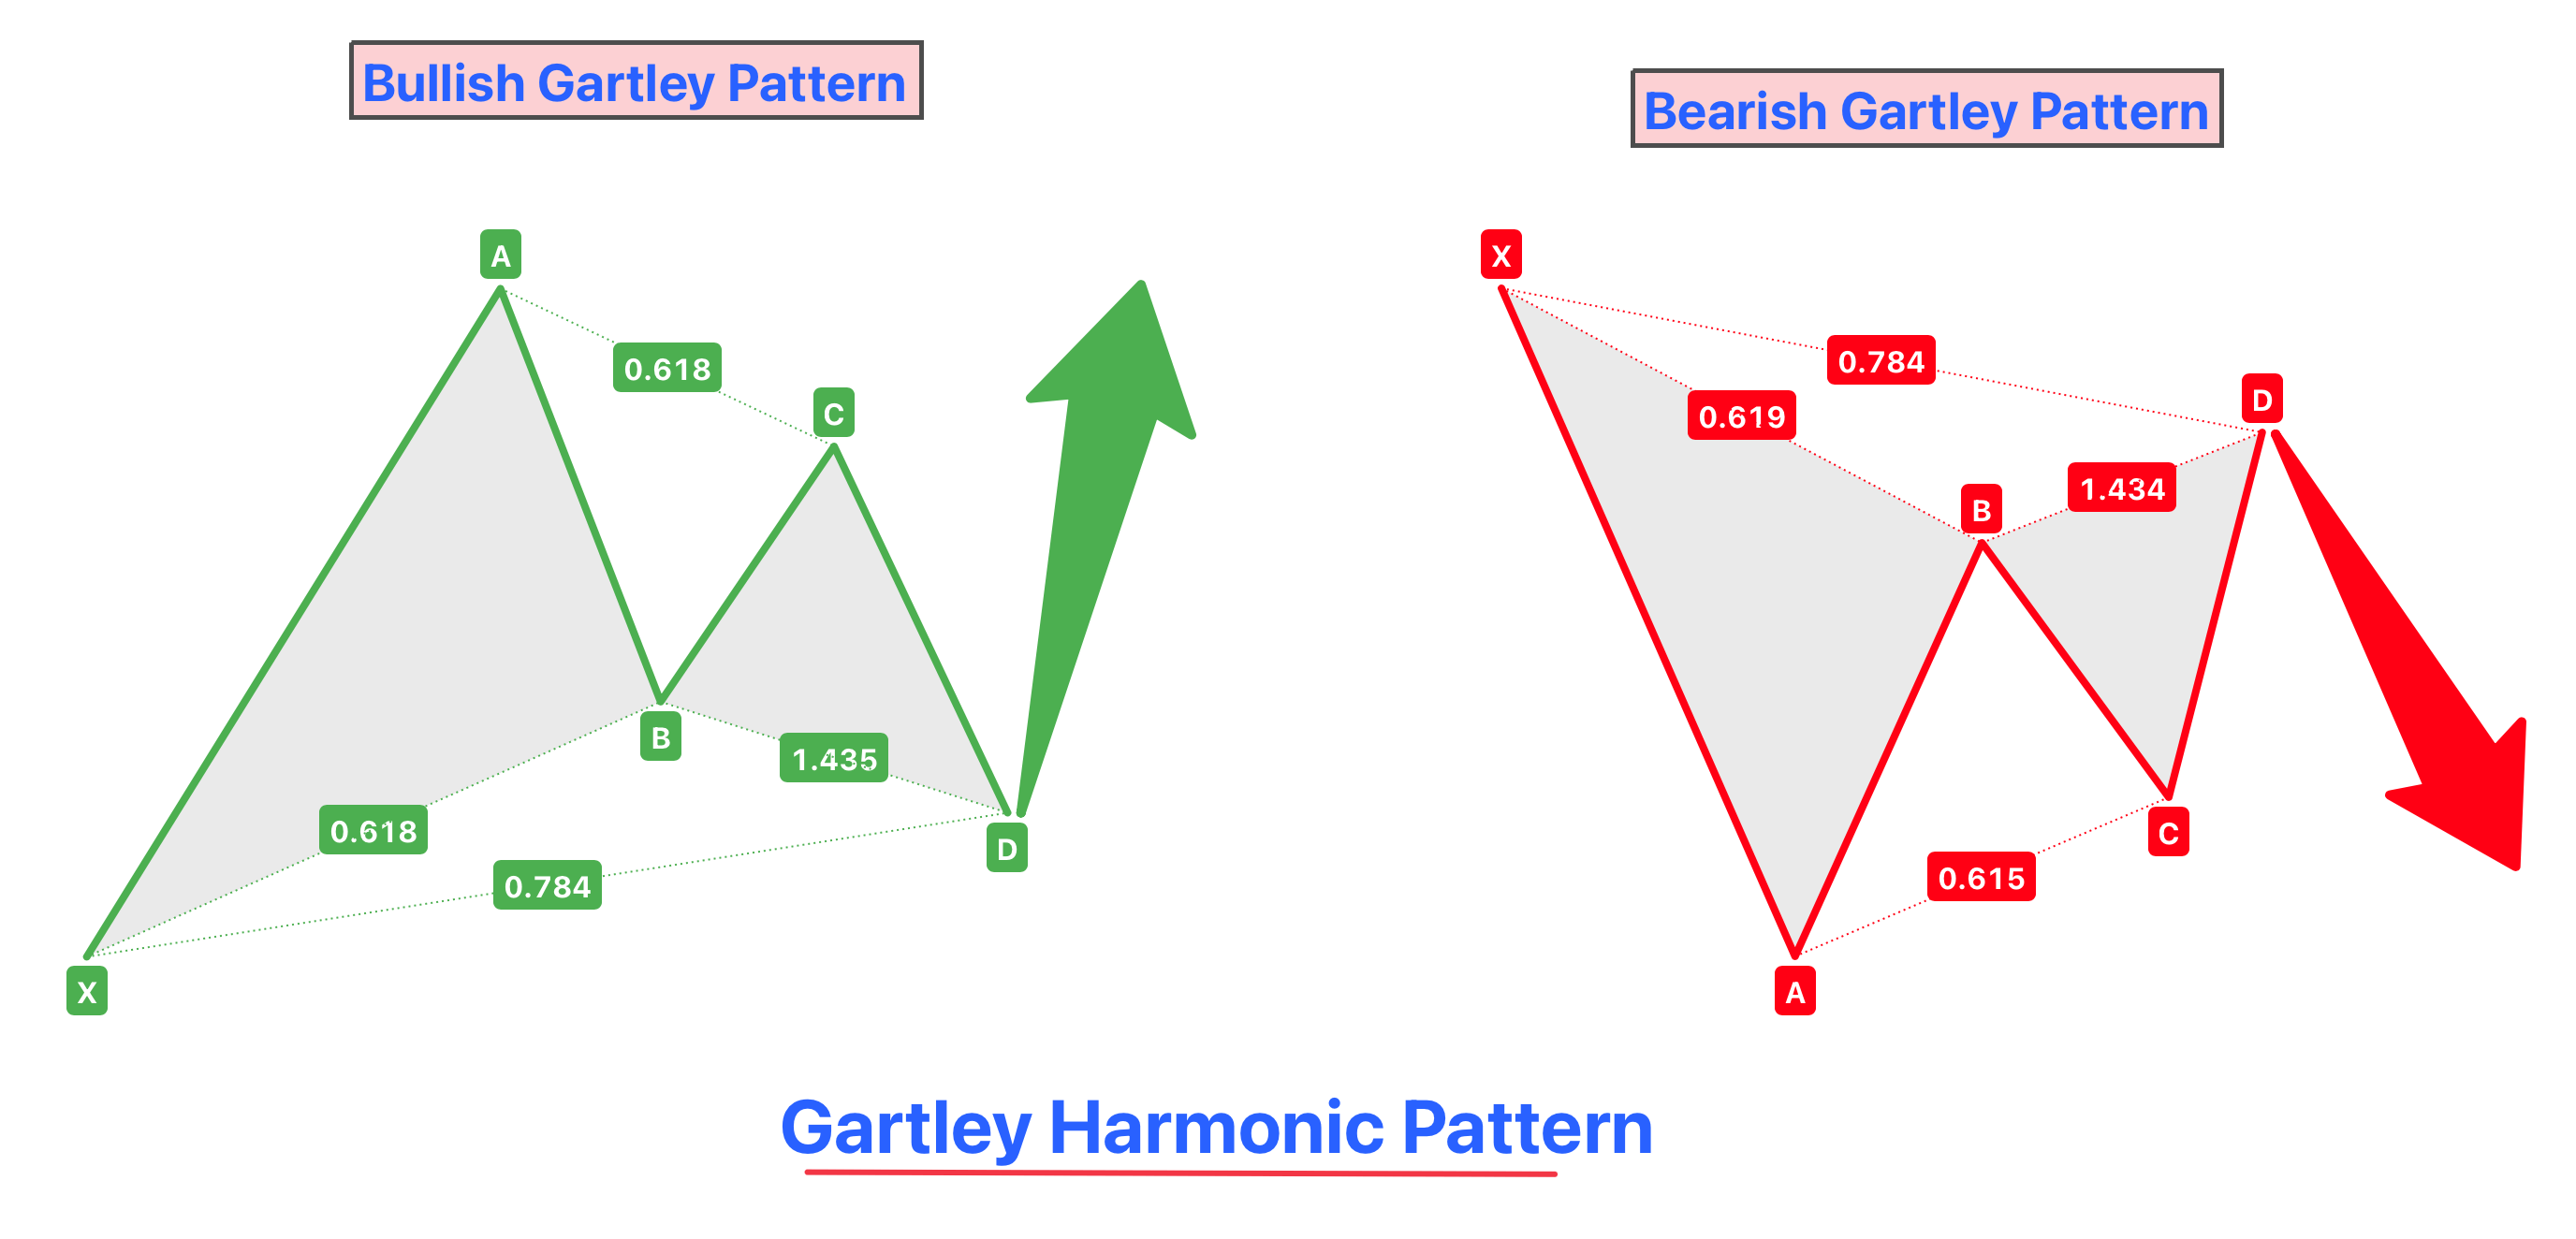
The Gartley Pattern is composed of four key legs, identified as XA, AB, BC, and CD, each with specific Fibonacci relationships:
- XA Leg: This is the initial leg of the pattern and sets the context for the formation.
- AB Leg: The AB leg retraces a specific Fibonacci percentage of the XA leg. Typically, this retracement is about 61.8%.
- BC Leg: Following the AB leg, the BC leg retraces a portion of AB. Often, this retracement is between 38.2% and 88.6% of AB.
- CD Leg: The final leg, CD, extends to 127.2% or 161.8% of the BC leg. Importantly, CD should also be a 78.6% retracement of the XA leg.
These Fibonacci relationships are crucial in validating the pattern and distinguishing it from other similar formations.
Bullish vs. Bearish Variants
The Gartley Pattern can be either bullish or bearish, depending on the direction of the initial XA leg:
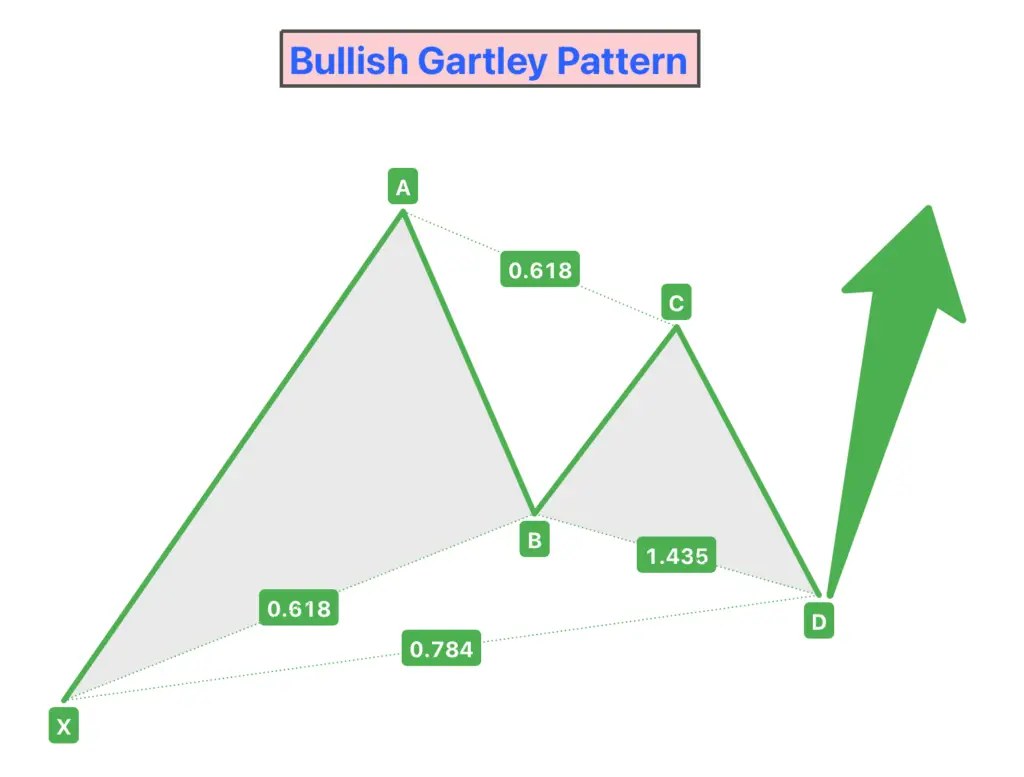
Bullish Gartley Pattern
Forms during a downtrend. The initial leg (XA) moves downward, and the pattern completes at the end of the CD leg, where a potential bullish reversal is anticipated.
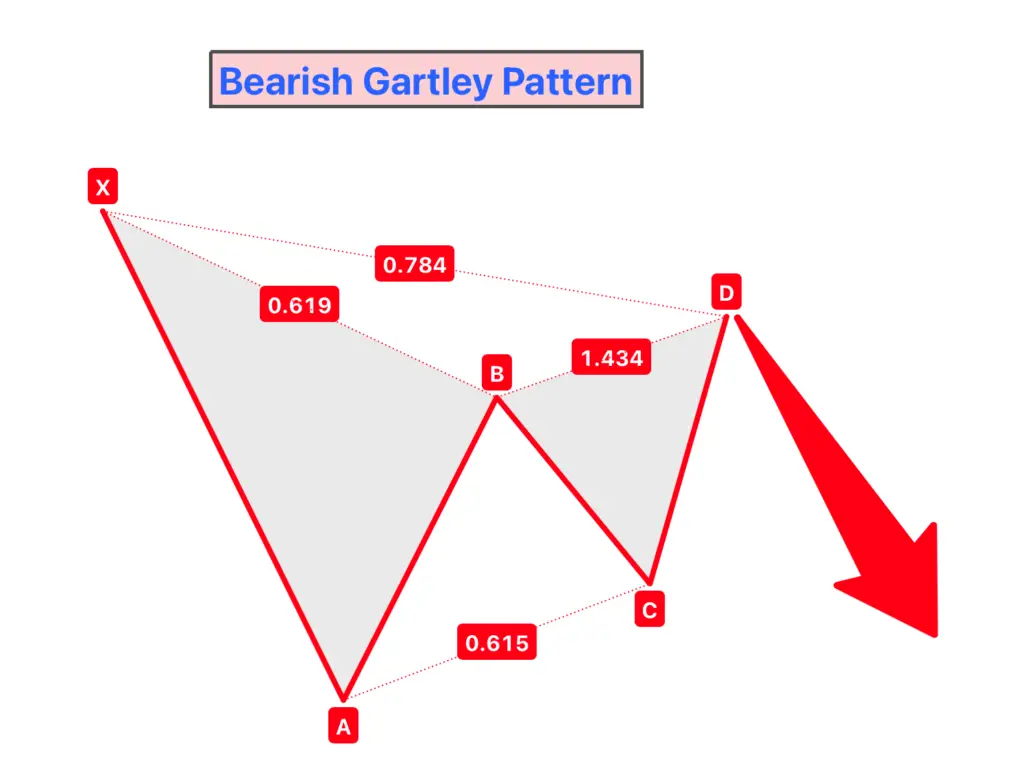
Bearish Gartley Pattern
Develops during an uptrend. Here, the XA leg moves upward, and the completion of the CD leg suggests a potential bearish reversal.
In both cases, the pattern indicates a potential reversal in the current trend. The bullish Gartley suggests buying opportunities where the bearish Gartley points towards selling opportunities.
Identifying the Gartley Pattern
Key Characteristics
The Gartley Pattern is defined by specific Fibonacci ratios between its legs, along with certain rules for pattern identification:
- XA Leg: This initial leg forms the foundation of the pattern. It can be either bullish or bearish.
- AB Leg: The AB leg should retrace 61.8% of the XA leg. This precise retracement is crucial for the pattern’s validity.
- BC Leg: The BC leg retraces between 38.2% and 88.6% of the AB leg. This range allows for some flexibility in the pattern formation.
- CD Leg: The final leg, CD, extends to either 127.2% or 161.8% of the BC leg’s length. Importantly, it should also retrace 78.6% of the XA leg. The completion of the CD leg is where the pattern suggests a trade entry.
The correct identification of these Fibonacci relationships is essential for the pattern to be considered valid.
Practical Tips: Spotting the Gartley Pattern on Price Charts
- Fibonacci Tool Usage: Utilize Fibonacci retracement and extension tools on your trading platform to measure the legs of the pattern accurately.
- Look for the ‘M’ or ‘W’ Shape: In a bullish pattern, the Gartley resembles a ‘W,’ while in a bearish pattern, it looks like an ‘M.’ This visual cue can be helpful in initial identification.
- Wait for Pattern Completion: Patience is key. The pattern is only valid once the CD leg has completed at the correct Fibonacci level.
- Context Matters: Ensure that the pattern forms in a logical place within the overall market trend. For example, a bullish Gartley should form during a downtrend.
- Check for Symmetry: While the legs don’t have to be perfectly symmetrical, the pattern should generally maintain a harmonious shape.
- Use Confirmation Indicators: To reinforce the validity of the pattern, use other technical indicators like RSI, MACD, or Stochastics for confirming the reversal signals.
Trading Strategies with the Gartley Pattern
Entry Points
When trading the Gartley Pattern, identifying the ideal entry points is crucial for maximizing potential gains and minimizing risks. The completion of the CD leg is typically where traders look to enter a trade.
- Bullish Gartley: In a bullish pattern, the ideal entry point is at the completion of the CD leg, which is usually at the 78.6% retracement of the XA leg. Traders would consider going long (buying) at this point.
- Bearish Gartley: For a bearish pattern, the entry point is again at the completion of the CD leg, where traders would look to go short (selling).
Stop Loss and Profit Targets
Setting appropriate stop losses and profit targets is essential to manage risk and lock in profits.
- Stop Loss:
- For a bullish Gartley, place the stop loss just below the lowest point of the CD leg.
- In a bearish Gartley, set the stop loss just above the highest point of the CD leg.
- This placement ensures you’re protected if the price action doesn’t follow the expected pattern.
- Profit Targets:
- Profit targets can be set using the Fibonacci retracement levels of the CD leg.
- A common approach is to set multiple targets: the first target could be at the 38.2% retracement of CD, and the second target at the 61.8% retracement.
- Adjusting targets based on key levels of support and resistance, as well as overall market conditions, can also be effective.
The Role of Fibonacci Ratios in the Gartley Pattern
Importance in the Gartley Pattern
Fibonacci ratios are integral to the structure and effectiveness of the Gartley Pattern. These ratios provide a mathematical foundation for the pattern, offering precise points for its formation and potential reversal zones.
- Structural Foundation: The specific Fibonacci ratios are what differentiate the Gartley Pattern from other chart formations. They provide a framework for identifying the potential start and end points of each leg within the pattern.
- Predictive Accuracy: The use of Fibonacci ratios enhances the predictive accuracy of the Gartley Pattern. By adhering to these ratios, traders can more reliably anticipate potential reversals and adjust their strategies accordingly.
Application
Applying Fibonacci retracements and extensions is key to identifying and trading the Gartley Pattern:
- Identifying the Legs:
- XA Leg: The initial move where no Fibonacci application is needed.
- AB Leg: Use the Fibonacci retracement tool on the XA leg to identify if AB retraces to the 61.8% level.
- BC Leg: Apply Fibonacci retracements to the AB leg to check if BC retraces to between 38.2% and 88.6%.
- CD Leg: Use Fibonacci extensions on the BC leg to determine if CD extends to 127.2% or 161.8%. Also, apply Fibonacci retracement from X to A to see if CD completes near the 78.6% level.
- Confirmation of the Pattern: The convergence of these Fibonacci levels at the end of the CD leg gives a strong indication of the pattern’s completion and potential reversal zones.
- Enhancing Predictive Power: Combining these Fibonacci tools with other technical indicators, like RSI or MACD, can provide additional confirmation of the pattern’s validity and increase the reliability of the signals it generates.
Combining the Gartley Pattern with Other Technical Tools
Support and Resistance: Aligning the Pattern with Key Levels
Integrating the Gartley Pattern with the concept of support and resistance enhances its effectiveness and reliability in trading.
- Reinforcing Reversal Points: When the completion points of the Gartley Pattern (particularly the D point of the CD leg) coincide with established support or resistance levels, it reinforces the potential for a market reversal at these points. This confluence adds an extra layer of confirmation to the signals provided by the pattern.
- Historical Price Levels: Identifying areas where the price has historically faced significant buying or selling pressure (support or resistance) can provide crucial insights. If these levels align with the Gartley Pattern’s key points, especially the completion of the CD leg, they can serve as strong indicators for entry or exit points.
- Psychological Price Levels: Round numbers or psychologically significant price levels often act as natural support or resistance zones. The interaction of the Gartley Pattern with these levels can further validate the pattern’s predictive power.
Other Technical Tools for Confluence
In addition to support and resistance, other technical analysis tools can be used in conjunction with the Gartley Pattern for more robust trading signals:
- Fibonacci Tools: As the Gartley Pattern itself is based on Fibonacci ratios, additional Fibonacci tools like extensions, retracements, and fans can be used for further confirmation.
- Oscillators and Indicators: Tools like the RSI (Relative Strength Index), Stochastics, or MACD (Moving Average Convergence Divergence) can indicate overbought or oversold conditions. When these indicators align with the completion points of the Gartley Pattern, it can indicate a stronger likelihood of a reversal.
- Candlestick Patterns: The appearance of certain candlestick patterns (like doji, hammer, engulfing patterns) at key points of the Gartley Pattern, particularly around the D point, can offer additional entry or exit signals.
Conclusion
In conclusion, the Gartley Pattern is a powerful and versatile tool in technical analysis, offering traders clear indications of potential market reversals. Its effectiveness is greatly enhanced when combined with other technical tools like support and resistance levels, Fibonacci tools, and various indicators. This holistic approach not only strengthens the reliability of the signals generated by the Gartley Pattern but also aids in making more informed trading decisions.

