Definition
The Cypher Harmonic Pattern is a technical analysis tool used in trading to predict market reversals. Characterized by its distinct and asymmetrical shape, the Cypher Pattern is formed by specific Fibonacci retracements and extensions. It’s known for its high accuracy in identifying potential price turnarounds, making it a choice among traders looking to capitalize on short-term market movements.
Structure of the Cypher Harmonic Pattern
Composition
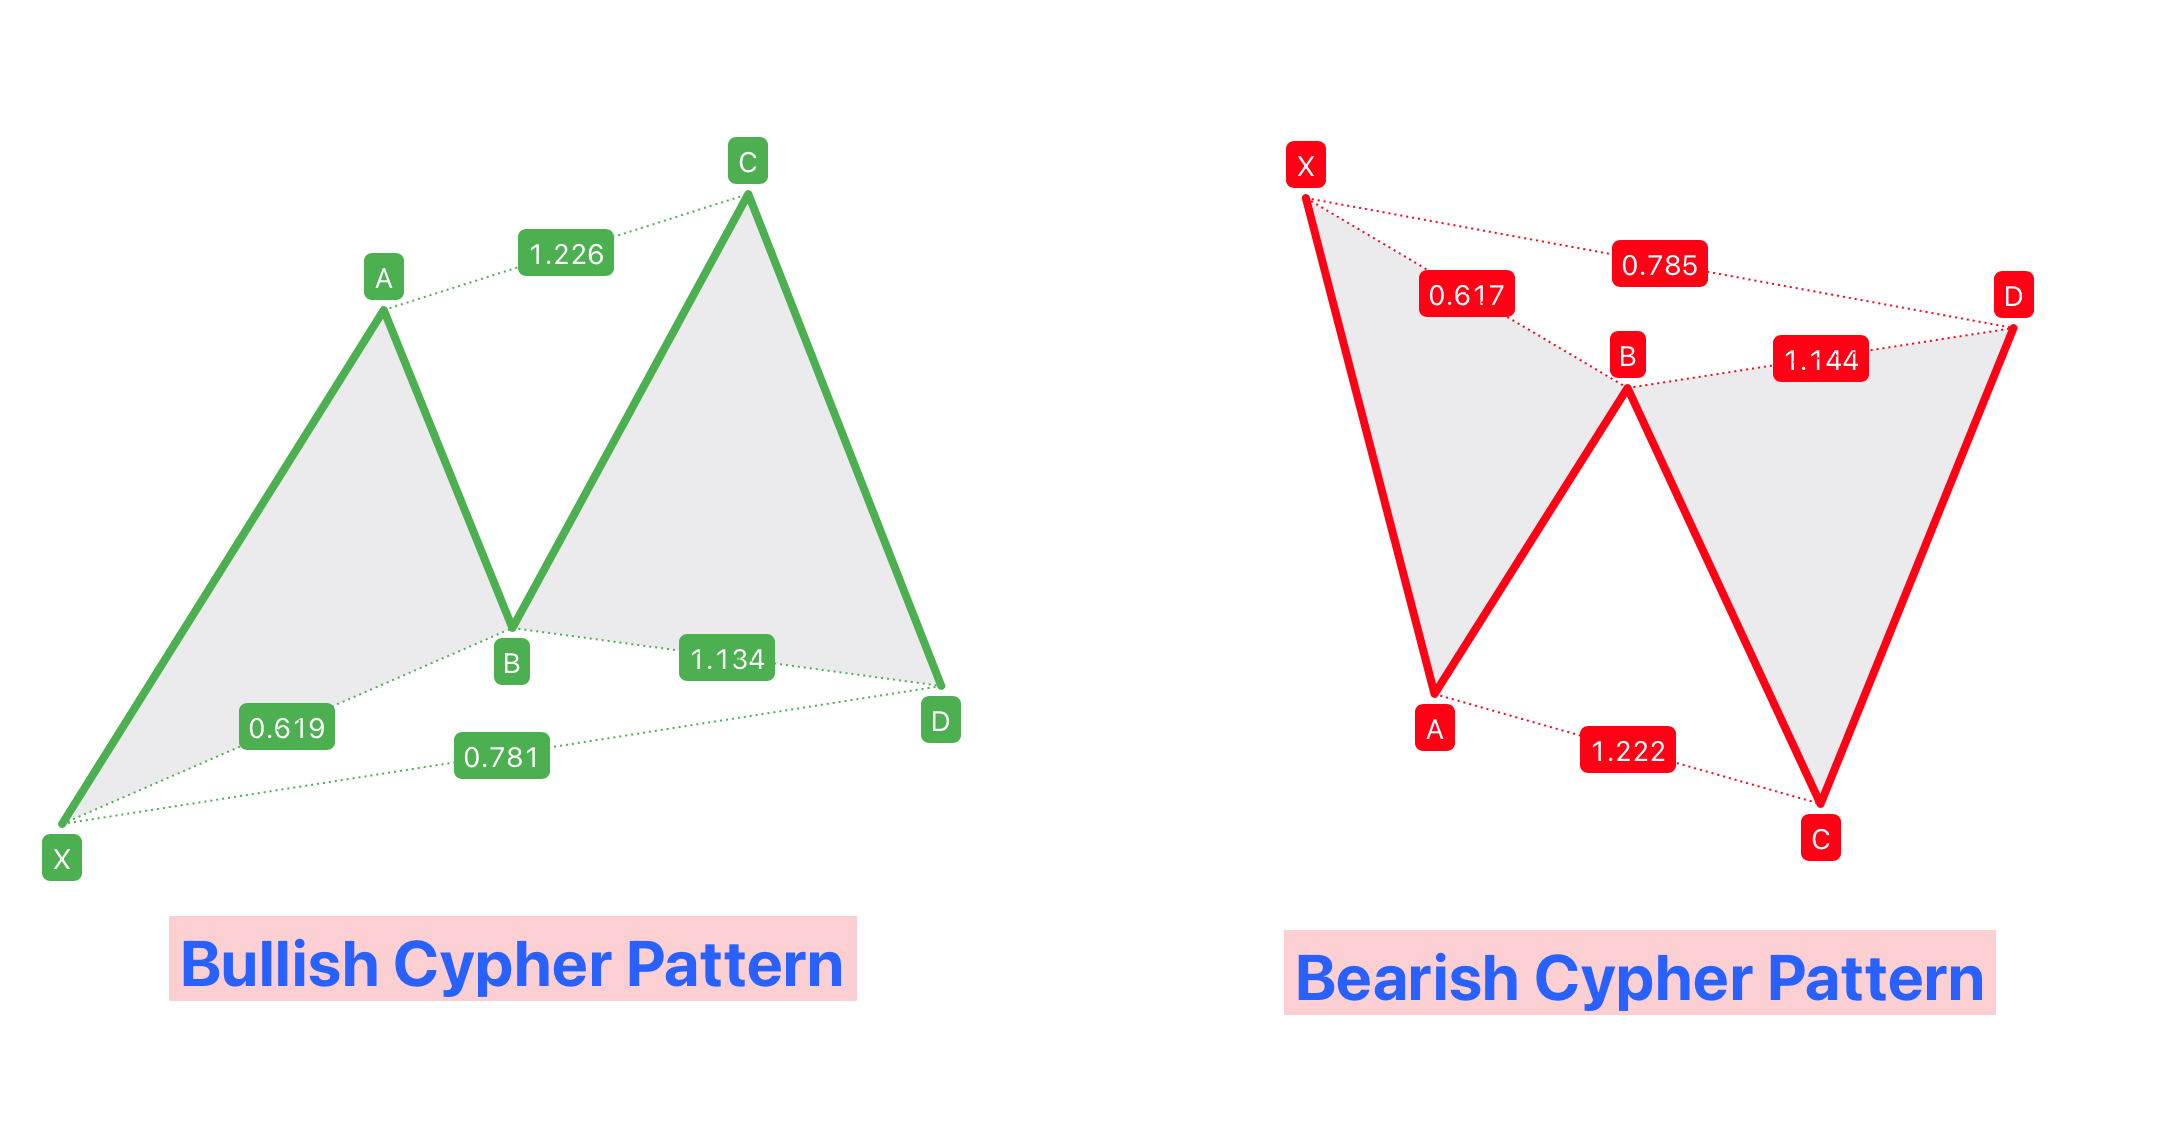
The Cypher Harmonic Pattern is defined by four critical legs – XA, AB, BC, and CD – each following specific Fibonacci levels:
- XA Leg: This initial leg forms the foundation of the pattern and can be either bullish or bearish.
- AB Leg: The AB leg retraces to 38.2% – 61.8% of the XA leg, which is less deep compared to some other harmonic patterns.
- BC Leg: This leg retraces from 113% to 141.4% of the AB leg, often extending beyond the start of the XA leg.
- CD Leg: The final and defining leg of the Cypher Pattern, the CD leg extends up to 78.6% of the XC leg.
Distinctive Features
The Cypher Pattern has several unique aspects that set it apart from other harmonic patterns:
- Specific AB Retracement: The AB leg retraces to a more specific range (38.2% – 61.8%) compared to other patterns.
- Extended BC Leg: The BC leg’s extension beyond the start of the XA leg is a distinctive feature of the Cypher Pattern.
- Precise CD Leg Extension: The CD leg extends to precisely 78.6% of the XC leg, a defining characteristic unique to the Cypher Pattern.
Identifying the Cypher Harmonic Pattern
Key Characteristics
To accurately identify a Cypher Harmonic Pattern, traders must understand its unique criteria and specific Fibonacci ratios:
- XA Leg: This initial leg establishes the context for the pattern and can move in any direction.
- AB Leg: The AB leg retraces to between 38.2% and 61.8% of the XA leg. This retracement range is critical for defining the Cypher Pattern.
- BC Leg: The BC leg extends beyond the XA leg, retracing from 113% to 141.4% of the AB leg.
- CD Leg: The final and most significant leg of the pattern, the CD leg extends to 78.6% of the XC leg.
These specific Fibonacci levels are essential for the identification and effectiveness of the Cypher Pattern.
Bullish and Bearish Cypher Patterns
The Cypher Pattern can appear in both bullish and bearish forms, providing trading opportunities in various market conditions:
- Bullish Cypher Pattern:
- Typically forms during a downtrend.
- The pattern begins with a downward XA leg, followed by a series of retracements and an upward CD leg.
- The completion of the CD leg at the 78.6% retracement level of the XC leg signals a potential bullish reversal, indicating buying opportunities.
- Bearish Cypher Pattern:
- Emerges during an uptrend.
- It starts with an upward XA leg, then retracements, and a downward CD leg.
- The pattern completes at the CD leg’s low point, suggesting a potential bearish reversal and a chance for short selling.
In both its bullish and bearish variations, the Cypher Pattern is defined by its distinctive Fibonacci ratios and structure, making it an important pattern for traders to recognize and use effectively.
Trading Strategies with the Cypher Harmonic Pattern
Entry Points
Choosing the right moment to enter a trade is key when using the Cypher Harmonic Pattern, as it helps maximize the pattern’s predictive accuracy.
- Bullish Cypher Pattern: In a bullish scenario, the ideal entry point is at the completion of the CD leg, signaling a potential upward reversal. This typically occurs at the 78.6% retracement level of the XC leg. Here, traders might consider initiating a long (buy) position.
- Bearish Cypher Pattern: For a bearish Cypher Pattern, the optimal entry point is at the end of the CD leg, which indicates a potential downward reversal. Traders should look to enter a short (sell) position at this point.
Stop Loss and Profit Targets
Effective risk management is crucial when trading with the Cypher Pattern, involving careful placement of stop losses and setting appropriate profit targets.
- Stop Loss:
- Bullish Pattern: Set the stop loss just below the lowest point of the CD leg to minimize losses if the market doesn’t move as anticipated.
- Bearish Pattern: Place the stop loss just above the highest point of the CD leg to guard against unexpected upward movements.
- The stop loss should be positioned at a point where the pattern is invalidated, offering a disciplined exit strategy.
- Profit Targets:
- Targets can be determined based on Fibonacci retracement levels of the CD leg or other critical market levels.
- A popular method is to have multiple profit targets, taking partial profits at different levels to optimize potential gains and manage risk.
- These targets are typically set at key Fibonacci levels or around areas of known support and resistance.
Trading the Cypher Pattern requires precision in pattern recognition, strategic timing for trade entries, and rigorous risk management.
The Role of Fibonacci in the Cypher Pattern
Fibonacci Ratios
The Fibonacci ratios in the Cypher Pattern play a crucial role in defining its structure and validating its potential as a reversal indicator. These mathematical ratios, fundamental in the world of technical analysis, guide the formation of the Cypher Pattern and are key to its effectiveness.
- Structural Formation: The Cypher Pattern is distinguished by its unique Fibonacci ratios in each leg, which are critical for the pattern’s accuracy in forecasting market reversals.
- Confirmation of the Pattern: The specific Fibonacci levels used in the Cypher Pattern are essential for its confirmation. These precise ratios differentiate the Cypher Pattern from other harmonic patterns and affirm its reliability as a reversal signal.
Application
Effective use of Fibonacci tools is essential for accurately identifying and trading the Cypher Pattern:
- Fibonacci Retracement Tool:
- Crucial for measuring the AB leg’s retracement relative to the XA leg, typically between 38.2% and 61.8%.
- Also used to verify the CD leg’s extension to 78.6% of the XC leg, a key aspect in confirming the pattern.
- Fibonacci Extension Tool:
- Helps in determining the overextension of the BC leg, which typically extends to 113% – 141.4% of the AB leg, going beyond the start of the XA leg.
Combining the Cypher Pattern with Other Technical Tools
Supporting Analysis
Blending the Cypher Pattern with additional technical analysis tools can enhance the strength and reliability of trading signals:
- Oscillators and Indicators:
- Tools like the RSI, Stochastic Oscillator, and MACD offer extra insights into market conditions and can corroborate the signals suggested by the Cypher Pattern.
- Volume indicators are also useful in confirming the pattern’s strength, particularly at the pattern’s completion.
- Other Chart Patterns:
- Aligning the Cypher Pattern with other recognized chart patterns can provide additional layers of confirmation, creating a more robust trading strategy.
Market Context
The effectiveness of the Cypher Pattern is maximized when aligned with the broader market context:
- Trend Analysis:
- The Cypher Pattern should be evaluated within the context of the overall market trend. Its predictive power may vary based on the market’s prevailing direction.
- In strongly trending markets, the Cypher may indicate a short-term reversal.
- Alignment with Market Phases:
- Ensuring the pattern fits within the market’s broader phases can enhance its applicability and relevance.
- Support and Resistance Levels:
- Considering key support and resistance levels in conjunction with the Cypher Pattern can provide further validation for its signals.
Conclusion
The Cypher Pattern, with its unique Fibonacci ratios, is a valuable tool in harmonic trading, offering precise entry and exit points. Its effectiveness is heightened when combined with other technical tools and contextual market analysis. A thorough understanding of market trends and the pattern’s alignment with key support and resistance levels is crucial for leveraging the Cypher Pattern effectively in trading strategies.

