Introduction to the Crab Patterns
Definition
The Crab Pattern is recognized as an advanced harmonic trading pattern, notable for its use of extreme Fibonacci levels. This pattern is specifically designed to identify potential reversal points in the market with a high degree of accuracy. Characterized by its unique structure, the Crab Pattern stands out for its steep retracements and extensions, offering traders insights into both the momentum and potential reversal zones of price movements.
Origin
The Crab Pattern was developed by Scott Carney, a prominent figure in the field of harmonic pattern trading. Carney’s work introduced the Crab Pattern as a refined approach to harmonic trading, with a particular emphasis on its extreme projections and retracements. This emphasis sets the Crab Pattern apart from other harmonic patterns, offering traders a distinct set of parameters for identifying high-probability trading opportunities.
Structure of the Crab Pattern
Composition
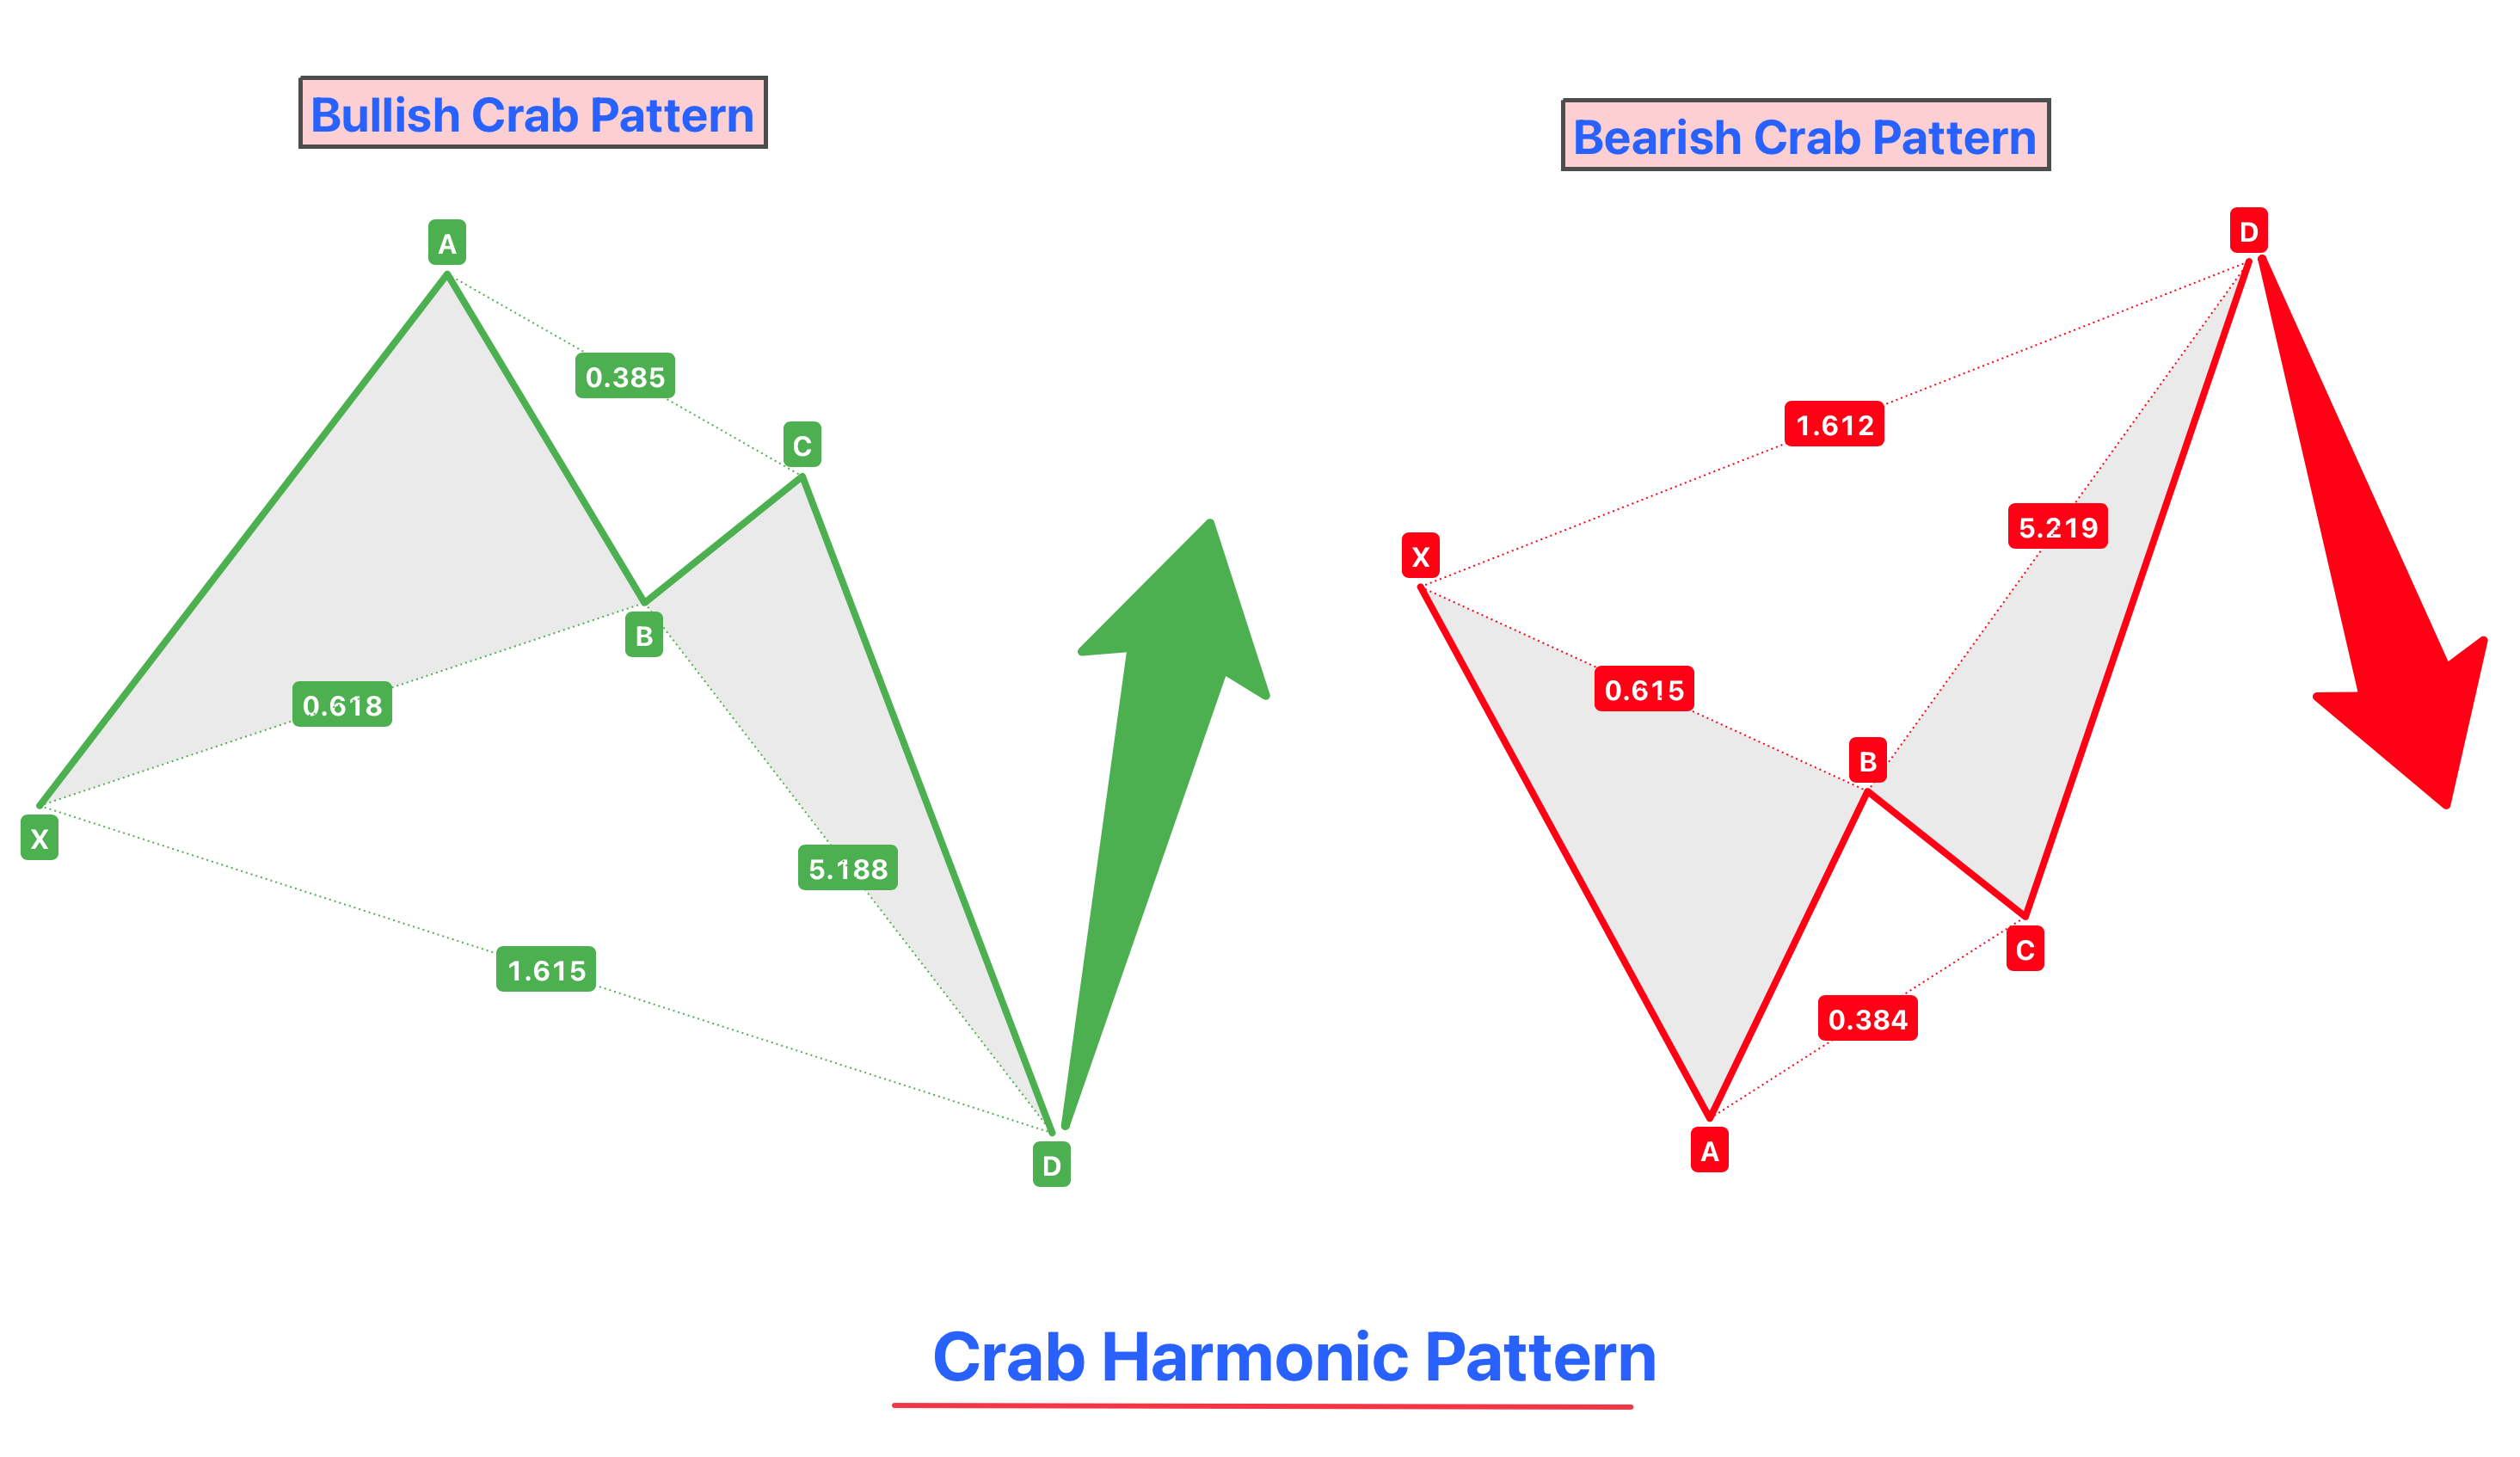
The Crab Pattern is composed of four critical legs – XA, AB, BC, and CD – each defined by specific Fibonacci ratios, giving it a unique and precise structure:
- XA Leg: This is the initial leg of the pattern and forms the basis for the subsequent movements.
- AB Leg: The AB leg retraces a significant portion of the XA leg, usually up to 38.2% or 61.8% Fibonacci levels.
- BC Leg: The BC leg then retraces the AB leg, typically extending to a Fibonacci level of 38.2% to 88.6%.
- CD Leg: The defining feature of the Crab Pattern is the extreme extension of the CD leg. It extends up to 161.8% to 224% of the XA leg and also usually retraces 161.8% of the BC leg.
Extreme Nature of the CD Leg’s Extension
- Significant Extension: The CD leg’s extension in the Crab Pattern is notably more extended than in other harmonic patterns. This extreme extension is key to the pattern’s high accuracy in predicting potential reversal points.
- Critical Confirmation Point: The completion of the CD leg, especially at the extreme Fibonacci levels, is crucial for confirming the pattern’s validity. It’s at this point where traders often look for potential reversals.
- Pattern Variations: The Crab Pattern can form both bullish and bearish variations. In the bullish variant, the CD leg extends upward sharply, while in the bearish variant, it extends downward.
The structure of the Crab Pattern, particularly the extreme nature of the CD leg’s extension, makes it a powerful tool in harmonic trading.
Identifying the Crab Pattern
Key Characteristics
The Crab Pattern is marked by specific and rigorous Fibonacci ratios for each of its legs, with the extended CD leg being a distinguishing feature:
- XA Leg: Initiates the pattern, but doesn’t involve a specific Fibonacci ratio for identification.
- AB Leg: Must retrace to either 38.2% or 61.8% of the XA leg.
- BC Leg: Retraces anywhere from 38.2% to 88.6% of the AB leg, showing the pattern’s flexibility.
- CD Leg: The most critical leg, extending up to 161.8% to 224% of the XA leg and often retracing 161.8% of the BC leg. This extreme extension is what makes the Crab Pattern unique and reliable for identifying reversals.
Bullish and Bearish Crab Patterns
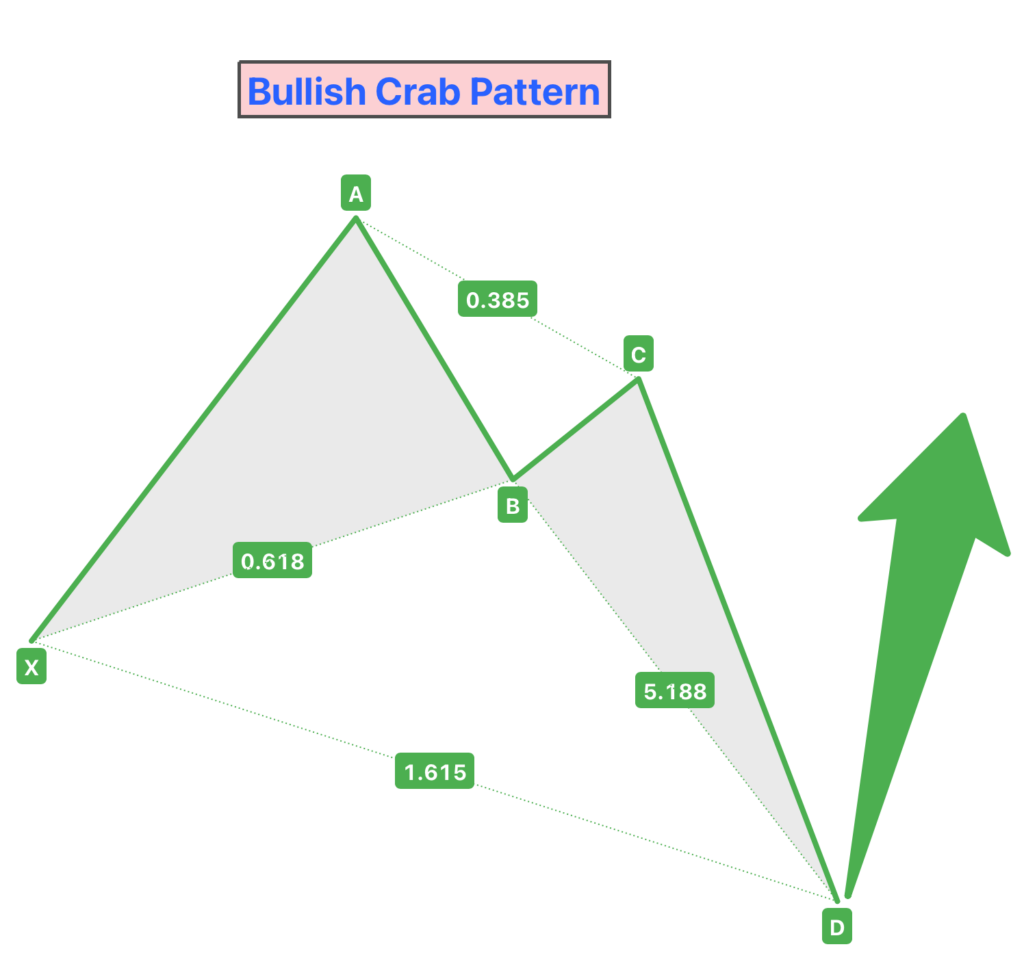
Bullish Crab Pattern
- Forms during a downtrend.
- The XA leg starts with a downward movement, followed by a series of retracements and an extended upward CD leg.
- Traders anticipate a bullish reversal upon the completion of the CD leg, looking for long entry opportunities.
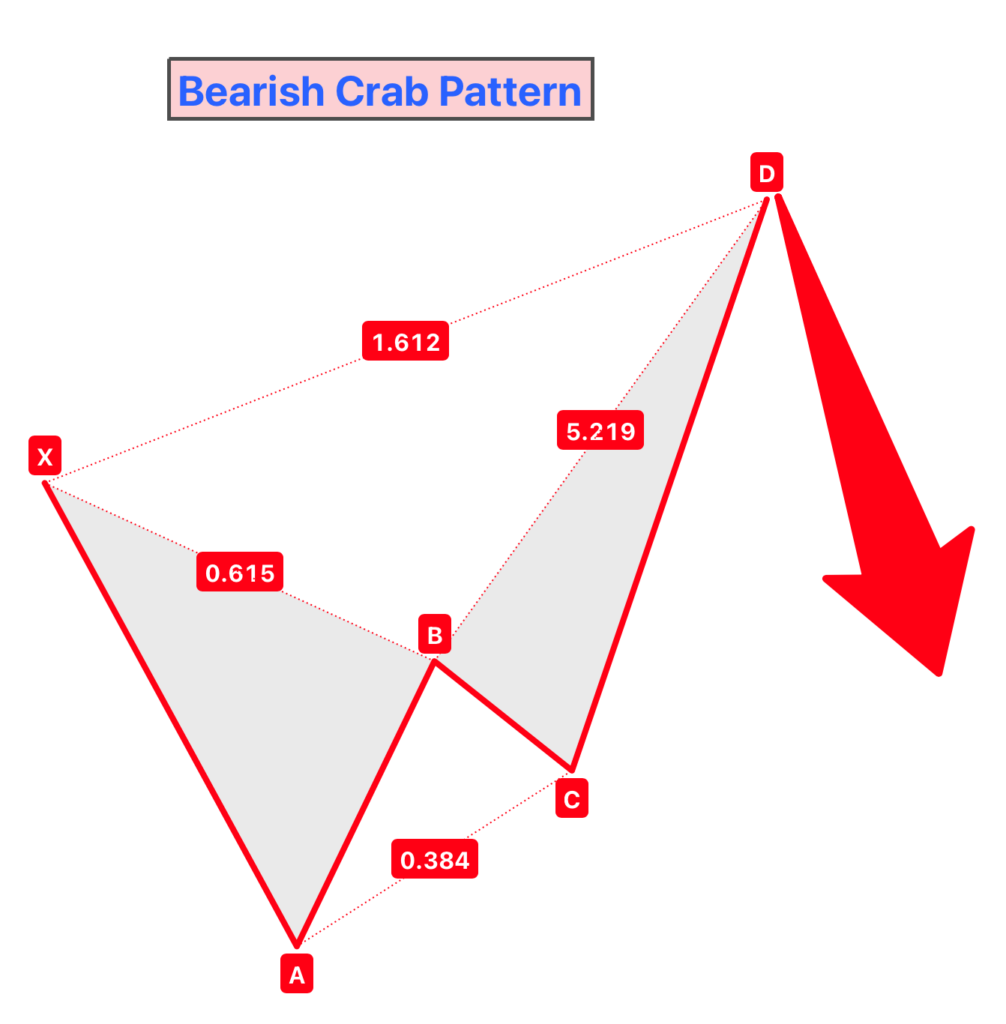
Bearish Crab Pattern
- Develops during an uptrend.
- The pattern begins with an upward XA leg, followed by retracements and a sharply extended downward CD leg.
- The completion of the CD leg signals a bearish reversal, where traders may consider shorting.
In both variations, the precise Fibonacci ratios and the extended CD leg are vital for correctly identifying the pattern. The Crab Pattern’s effectiveness in predicting reversals lies in its unique Fibonacci structure, making it a valuable tool in the trader’s toolkit.
Trading with the Crab Pattern
Entry Points
The completion of the CD leg in the Crab Pattern is critical for identifying potential entry points for a trade. This point signifies a possible reversal, making it an optimal moment for traders to enter the market.
- Bullish Crab Pattern: For a bullish pattern, the ideal entry point is at the completion of the CD leg, which typically signifies the end of a downtrend and the beginning of an uptrend. Traders would look to enter a long (buy) position here.
- Bearish Crab Pattern: In the case of a bearish pattern, the completion of the CD leg indicates the potential end of an uptrend and the start of a downtrend. This is where traders might consider entering a short (sell) position.
Stop Loss and Profit Targets
Given the extreme nature of the Crab Pattern, particularly the extended CD leg, setting appropriate stop losses and profit targets is crucial for effective risk management.
- Stop Loss:
- Bullish Pattern: Place the stop loss just below the lowest point of the CD leg.
- Bearish Pattern: Set the stop loss just above the highest point of the CD leg.
- This strategy helps to minimize potential losses if the market does not move as anticipated after the pattern completion.
- Profit Targets:
- Setting profit targets requires analyzing previous swing highs and lows, along with Fibonacci retracement levels.
- A common approach is to set multiple profit targets, taking partial profits at different levels, like the 38.2%, 61.8%, or 78.6% retracement of the CD leg.
- Given the pattern’s extreme nature, traders may aim for larger profit targets compared to other harmonic patterns.
When trading the Crab Pattern, it is also essential to consider the overall market conditions and integrate other technical analysis tools for confirmation.
The Role of Fibonacci in the Crab Pattern
Importance of Fibonacci Ratios
Fibonacci ratios play a central role in the structure and identification of the Crab Pattern. These ratios are not arbitrary but are derived from a number sequence known for its prevalence in natural and financial patterns. In the context of the Crab Pattern, Fibonacci ratios provide precision to the pattern’s formation, making it a highly predictive tool for market reversals.
- Precision in Pattern Formation: The specific Fibonacci levels dictate the shape and structure of the Crab Pattern. Each leg of the pattern conforms to a particular Fibonacci ratio, ensuring the accuracy of the pattern’s formation.
- Confirmation of Reversal Points: The Fibonacci ratios used in the Crab Pattern help in confirming potential reversal points in the market, especially at the completion of the extended CD leg.
Application
Applying Fibonacci retracement and extension tools is key to identifying the Crab Pattern within market price movements:
- Fibonacci Retracement Tool:
- Used to measure the retracement levels of the AB and BC legs against the XA leg. For instance, checking if the AB leg retraces to 38.2% or 61.8% of the XA leg.
- In identifying the completion of the CD leg, the Fibonacci retracement tool is applied from the beginning of the XA leg to identify the crucial 161.8% retracement level.
- Fibonacci Extension Tool:
- The extension tool is used to measure the potential targets for the CD leg. It helps to determine if the CD leg extends up to 224% of the BC leg, as required in the Crab Pattern.
Traders proficient in using these Fibonacci tools can effectively spot and trade the Crab Pattern. Understanding the nuances of Fibonacci retracement and extension levels is crucial for accurately identifying the pattern and its completion points.
Combining the Crab Pattern with Other Technical Tools
Supporting Tools for Enhanced Confirmation
Integrating the Crab Pattern with other technical tools can significantly enhance the reliability of trading signals and provide a more comprehensive market analysis.
- Oscillators and Indicators:
- Tools like the Relative Strength Index (RSI), Stochastic Oscillator, and Moving Average Convergence Divergence (MACD) can be invaluable. For instance, if the completion of the Crab Pattern coincides with an overbought signal on the RSI in a bearish setup, it strengthens the likelihood of a successful trade.
- Volume indicators can also be used to confirm the strength of the reversal signaled by the Crab Pattern.
- Other Chart Patterns:
- Combining the Crab Pattern with other chart patterns like head and shoulders, double tops/bottoms, or triangles can provide additional layers of confirmation.
- The congruence of the Crab Pattern with these classical patterns can indicate a stronger and more reliable trading setup.
Market Context and Overall Trends
Understanding the overall market context and current trends is essential when trading the Crab Pattern:
- Trend Analysis: The Crab Pattern, like all harmonic patterns, should not be analyzed in isolation. The prevailing market trend can significantly impact the effectiveness of the pattern. For instance, a bearish Crab Pattern during a strong downtrend might indicate a more reliable reversal signal.
- Market Conditions: The broader market conditions, including economic indicators, market sentiment, and significant events, should also be considered. These factors can influence price movements and the success of trades based on the Crab Pattern.
In conclusion, while the Crab Pattern is a powerful tool on its own, its effectiveness is enhanced when combined with other technical analysis tools and considered within the context of the broader market.
Conclusion
In summary, the Crab Pattern is a sophisticated and powerful harmonic trading tool, especially useful for identifying potential market reversals due to its reliance on extreme Fibonacci levels. Its effectiveness is significantly increased when it is combined with other technical analysis tools, such as oscillators, indicators, and traditional chart patterns. However, it’s essential for traders to also consider the broader market context and prevailing trends when applying the Crab Pattern to their trading strategies.

