Introduction to the Bat Pattern
Definition
The Bat Pattern is a prominent harmonic chart pattern utilized extensively in the trading world. It is characterized by its precise Fibonacci ratios, which are key to its structure and efficacy. This pattern is primarily used to identify potential reversals in the market, offering traders insights into opportune moments for trade entries and exits.
Significance
- Predictive Power: The Bat Pattern is highly regarded for its ability to predict market reversals. Its structure, dictated by specific Fibonacci ratios, allows traders to anticipate changes in market direction with a higher degree of confidence.
- Reliability: Among harmonic patterns, the Bat Pattern is celebrated for its reliability. Its distinct Fibonacci measurements provide a systematic approach to trading, which can be more accurate compared to other chart patterns.
- Versatility: The Bat Pattern is versatile and can be identified in various market conditions and across different timeframes. This adaptability makes it a valuable tool for many traders, from day traders to long-term investors.
- Risk Management: By offering clear points for stop-loss and profit-target placements, the Bat Pattern aids in effective risk management. This aspect is crucial for traders aiming to balance potential rewards with the inherent risks of trading.
The Bat Pattern’s significance in trading stems from its unique combination of Fibonacci levels and its potential to indicate key reversal points.
Structure of the Bat Pattern
Composition
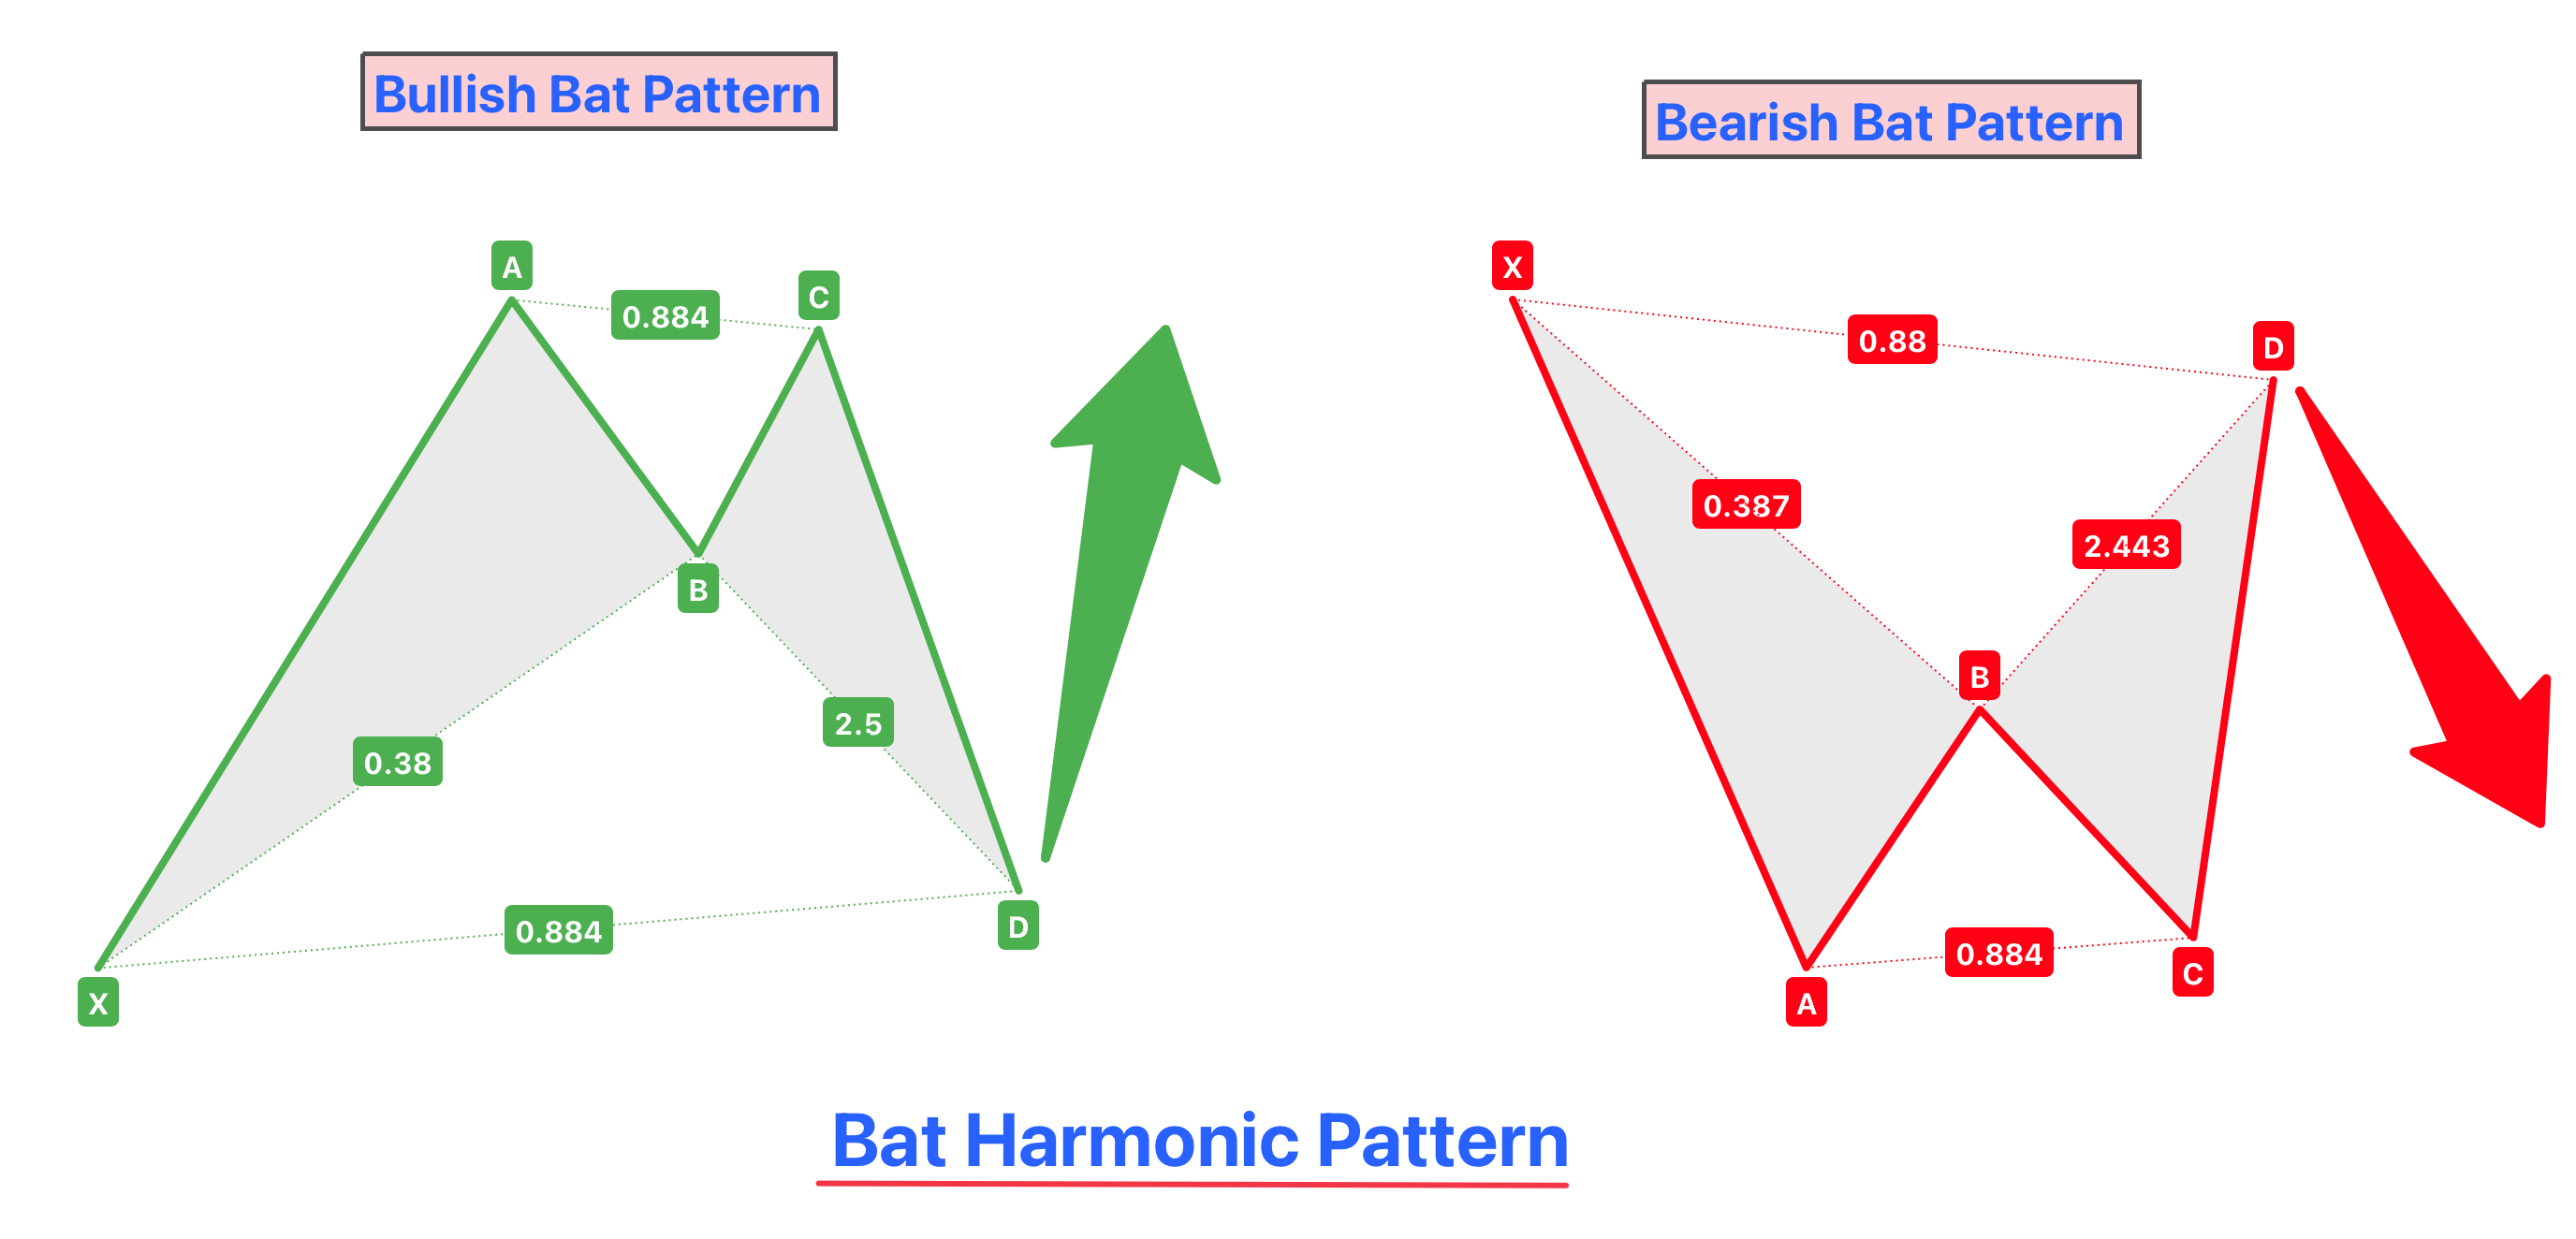
The Bat Pattern is composed of four critical legs – XA, AB, BC, and CD – each characterized by distinct Fibonacci retracements and extensions:
- XA Leg: This is the initial leg that sets the stage for the pattern. It can be either bullish or bearish.
- AB Leg: The AB leg retraces approximately 38.2% to 50% of the XA leg. This retracement is not as deep as in some other harmonic patterns.
- BC Leg: This leg retraces anywhere from 38.2% to 88.6% of the AB leg.
- CD Leg: The final and crucial leg of the Bat Pattern, the CD leg extends to 88.6% of the XA leg. Additionally, it often retraces 161.8% to 261.8% of the BC leg.
Distinctive Features
What sets the Bat Pattern apart from other harmonic patterns are a few key aspects:
- Moderate AB Retracement: The AB leg retraces only up to 50% of the XA leg, which is less than the deep retracements seen in patterns like the Gartley or the Butterfly.
- Precise CD Leg Extension: The CD leg’s extension to exactly 88.6% of the XA leg is a defining characteristic of the Bat Pattern. This precision differentiates it from other patterns.
- Overall Structure: The Bat Pattern typically appears more “compact” compared to other harmonic patterns due to its specific Fibonacci ratios.
Understanding and identifying these distinct features is essential for traders looking to effectively trade the Bat Pattern.
Identifying the Bat Pattern
Key Characteristics
To accurately identify a Bat Pattern, traders must be familiar with its detailed criteria and specific Fibonacci ratios:
- XA Leg: This initial leg sets the stage for the pattern and can be in any direction.
- AB Leg: The AB leg should retrace between 38.2% and 50% of the XA leg. This moderate retracement is a key feature of the Bat Pattern.
- BC Leg: The BC leg retraces between 38.2% and 88.6% of the AB leg, offering some flexibility in the pattern’s formation.
- CD Leg: The CD leg is the most critical aspect of the pattern, extending up to 88.6% of the XA leg. Also, it often retraces between 161.8% and 261.8% of the BC leg.
These precise Fibonacci measurements are essential for the pattern’s identification and effectiveness.
Bullish and Bearish bat patterns
The Bat Pattern can manifest in both bullish and bearish forms, each signaling potential trading opportunities in different market conditions:
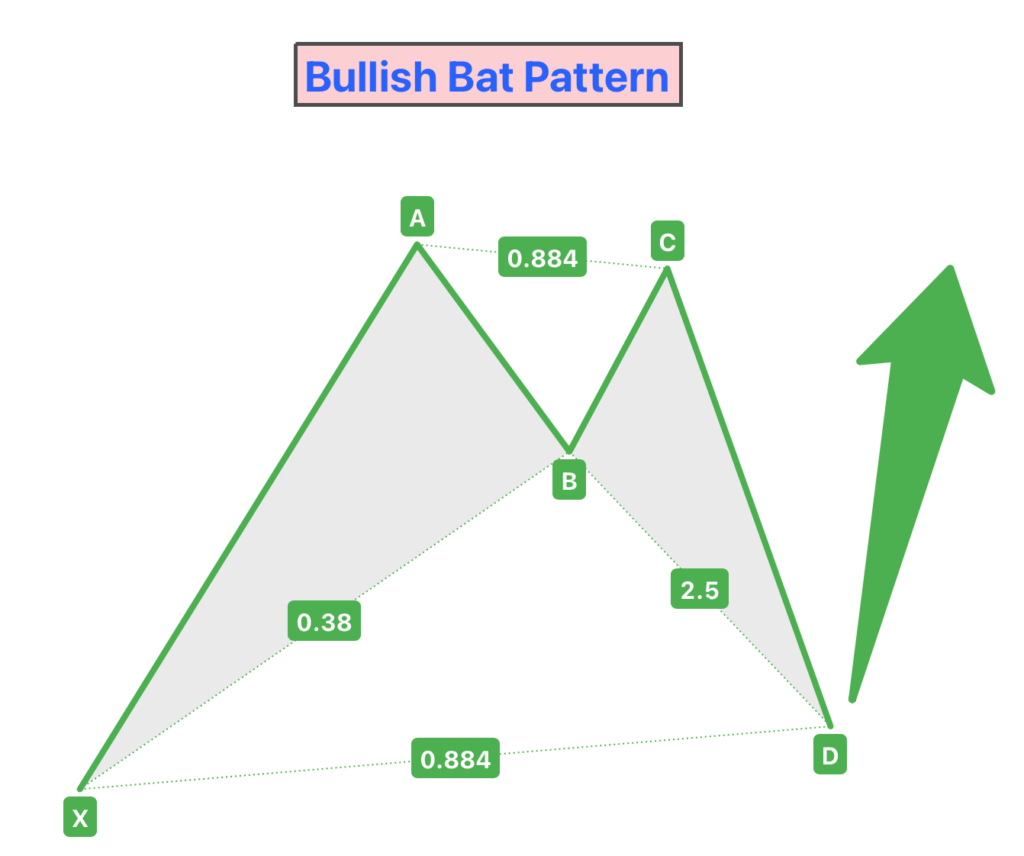
Bullish Bat Pattern
- Forms during a downtrend.
- The pattern starts with a downward XA leg, followed by a series of retracements and an upward CD leg.
- The completion of the CD leg, particularly at the 88.6% retracement level of the XA leg, signals a potential bullish reversal, where traders might look for buying opportunities.
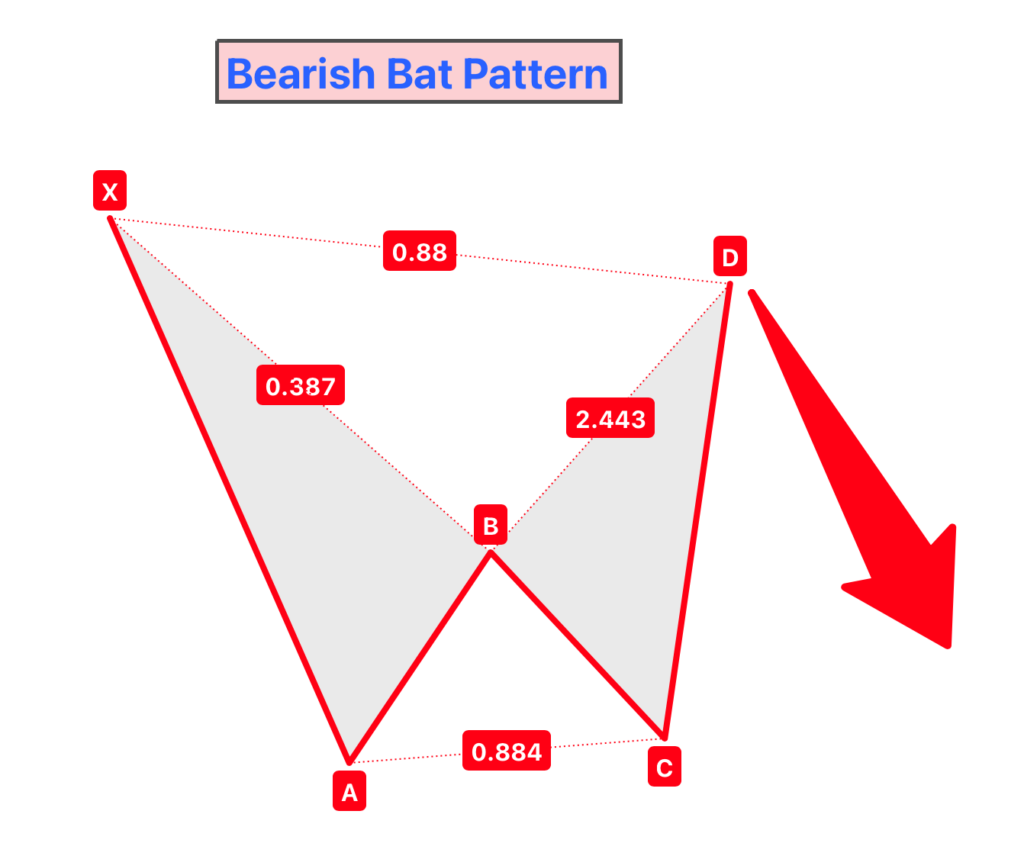
Bearish Bat Pattern
- Develops during an uptrend.
- Begins with an upward XA leg, followed by retracements and a downward CD leg.
- The pattern completes at the lower end of the CD leg, suggesting a potential bearish reversal and an opportunity for short selling.
In both bullish and bearish variations, the specific Fibonacci ratios and the pattern’s unique structure are crucial for correctly identifying the Bat Pattern.
Trading Strategies with the Bat Pattern
Entry Points
Identifying the optimal moments for trade entry when dealing with the Bat Pattern is crucial for capitalizing on its predictive power.
- Bullish Bat Pattern: In a bullish setup, the ideal entry point is at the completion of the CD leg, where the pattern suggests a potential upward reversal. This is typically at the 88.6% retracement level of the XA leg, where traders might consider going long (buying).
- Bearish Bat Pattern: For a bearish Bat Pattern, the entry point is at the completion of the CD leg, indicating a potential downward reversal. Traders would look to enter a short position (selling) at this juncture.
Stop Loss and Profit Targets
Properly setting stop losses and profit targets is vital for effectively managing risk and securing potential profits when trading with the Bat Pattern.
- Stop Loss:
- Bullish Pattern: Place the stop loss just below the lowest point of the CD leg to limit potential losses if the expected upward reversal doesn’t materialize.
- Bearish Pattern: Set the stop loss just above the highest point of the CD leg, protecting against an unexpected upward price movement.
- The stop loss should be positioned where the pattern would be invalidated, ensuring a disciplined exit strategy if the market goes against the trade.
- Profit Targets:
- Profit targets can be set based on Fibonacci retracement levels of the CD leg or other significant price levels identified through analysis.
- A common approach is to set multiple profit targets, capturing partial profits at various levels to maximize potential gains while managing risk.
- These targets are often placed at key Fibonacci levels or near previously identified support and resistance levels.
Trading the Bat Pattern involves a careful balance of precision in identifying the pattern, strategic entry points, and diligent risk management through stop losses and profit targets.
The Role of Fibonacci in the Bat Pattern
Fibonacci Ratios
Fibonacci ratios play a pivotal role in the formation and validation of the Bat Pattern. These mathematical ratios are not arbitrarily selected but are derived from a number sequence known to have a significant presence in natural and financial patterns. In the context of the Bat Pattern, these ratios help define its unique structure and provide potential reversal zones.
- Structural Formation: The Bat Pattern relies on specific Fibonacci ratios for each of its legs. The precision of these ratios is what gives the Bat Pattern its high level of accuracy in predicting market reversals.
- Confirmation of the Pattern: The adherence to exact Fibonacci ratios is crucial for confirming the Bat Pattern. These ratios help distinguish the Bat from other similar patterns and validate its potential as a reversal indicator.
Application
Effectively using Fibonacci tools is key to accurately identifying and trading the Bat Pattern:
- Fibonacci Retracement Tool:
- This tool is essential for measuring the retracement levels of the AB and BC legs relative to the preceding legs (XA and AB, respectively). For instance, ensuring the AB leg retraces close to 38.2% to 50% of the XA leg is a critical step in identifying the pattern.
- The completion of the CD leg, particularly at the 88.6% retracement level of the XA leg, is another crucial aspect confirmed using Fibonacci retracements.
- Fibonacci Extension Tool:
- This tool helps in determining the potential projection of the CD leg. It is used to confirm whether the CD leg extends to the required Fibonacci level relative to the BC leg.
Using these Fibonacci tools allows traders to spot the Bat Pattern with greater accuracy and execute trades based on its completion.
Combining the Bat Pattern with Other Technical Tools
Supporting Analysis
Integrating the Bat Pattern with other technical indicators and chart patterns can significantly strengthen the confirmation of trading signals, leading to more robust trading strategies.
- Oscillators and Indicators:
- Tools like the Relative Strength Index (RSI), Stochastic Oscillator, and Moving Average Convergence Divergence (MACD) can provide additional insights into market conditions. For instance, an oversold RSI at the completion of a bullish Bat Pattern can reinforce the likelihood of a reversal.
- Volume indicators can also be valuable in confirming the strength of the reversal signaled by the Bat Pattern. An increase in volume at the pattern’s completion can suggest stronger market participation in the potential reversal.
- Other Chart Patterns:
- Combining the Bat Pattern with classical chart patterns (like head and shoulders, triangles, or double tops and bottoms) can offer additional layers of confirmation.
- The convergence of these patterns with the completion point of the Bat Pattern can indicate a more robust and reliable trading setup.
Market Context
Understanding the overall market context and aligning the Bat Pattern with current market trends is crucial for its effective application:
- Trend Analysis:
- The Bat Pattern, like all harmonic patterns, should be analyzed in the context of the prevailing market trend. Its effectiveness can be influenced by the strength and nature of the underlying trend.
- In strong trending markets, the pattern may indicate a temporary retracement rather than a full trend reversal.
- Alignment with Market Phases:
- It’s important to ensure that the pattern aligns with the market’s broader phases – whether in accumulation, distribution, or trend stages. This alignment ensures that the pattern is in sync with the broader market dynamics.
- Support and Resistance Levels:
- Aligning the Bat Pattern with key support and resistance levels can provide additional validation for the pattern. These levels can act as potential reversal zones in line with the pattern’s predictions.
Conclusion
In summary, the Bat Pattern is a valuable and effective tool in the realm of harmonic trading, offering precise entry and exit points through its distinct Fibonacci ratios. Its effectiveness is further enhanced when combined with other technical indicators and market analysis tools. Understanding the broader market context and aligning the pattern with current trends and support and resistance levels can significantly improve the accuracy of trading signals derived from the Bat Pattern.

