Imagine you’re watching a soccer game where a player tries to score a goal, but instead of hitting the net, the ball bounces off the post. In trading, something similar happens, and it’s called a “mitigation block.” A mitigation block in forex trading is like a missed goal in a soccer game. It happens when the price in the market tries to reach a new high or low but can’t make it because there’s something in the way, just like the order block in our soccer analogy.
For example, let’s say the price was trying to climb to a new high point, but it couldn’t because there was a big order waiting that stopped it. This moment, where the price fails to reach a new high and starts to drop, is what we call a “mitigation block.” It’s a sign that the price is about to change direction. So, if the price was going up but hits this block and starts to fall, we expect it to go down further, possibly even lower than it was before it tried to climb.
When the price starts to drop after hitting a mitigation block, it leaves behind what we call a “liquidity void.” Think of it as an empty space that the price skipped over on its way down. Later on, the price often comes back to fill in this empty space, moving up to cover about half of it. This movement back is crucial because it gives traders a hint about where to enter or exit the market.
In short, mitigation blocks are like signals in the market, showing us where the price tried to reach but couldn’t. By understanding these blocks, traders can get a better idea of when to buy or sell, making smarter decisions in their trading.
How Mitigation Blocks Form?
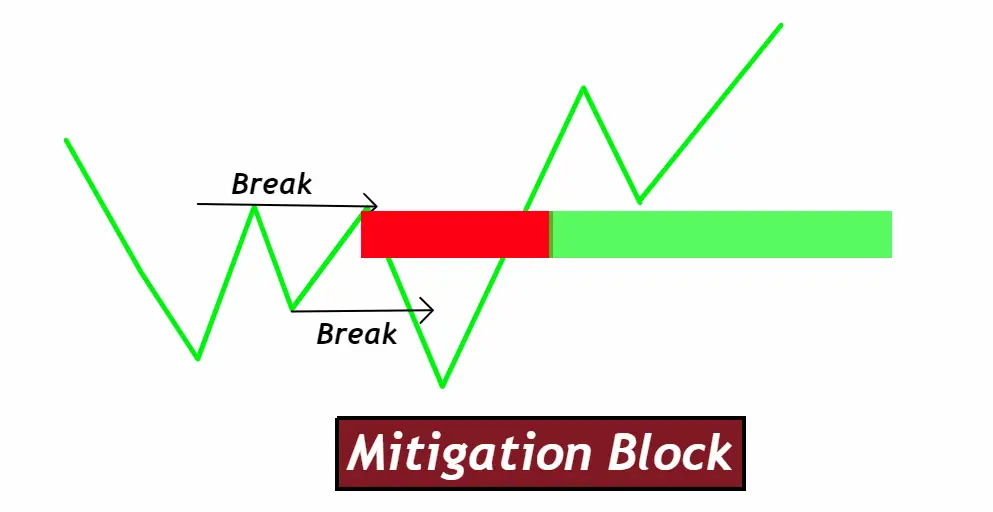
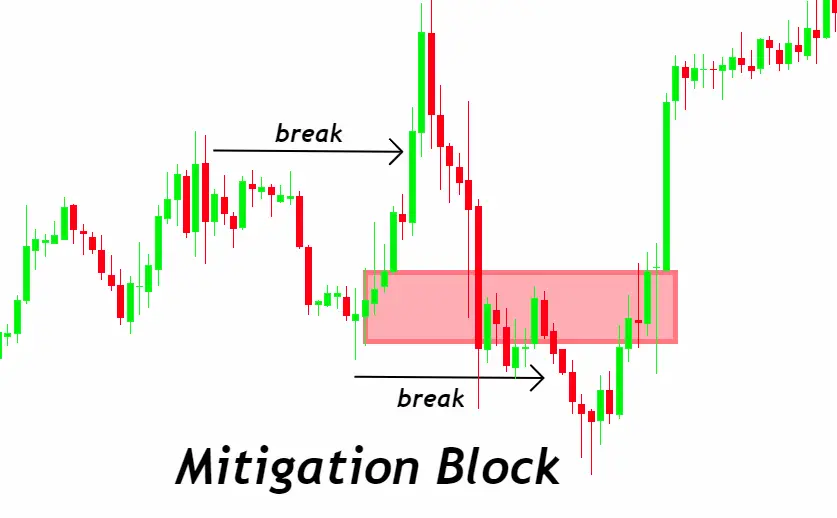
Sometimes in trading, the price tries to push to a new high or drop to a new low but gets stopped in its tracks. This stopping point is what we call a “mitigation block.” It’s like when you’re trying to reach for something on a high shelf, but something blocks you from stretching all the way. In the market, this “something” is usually a bunch of orders waiting at a certain price level that either buyers or sellers can’t get past.
What’s a Liquidity Void?
Think of a liquidity void like an empty space on a dance floor. The price moves quickly through this space because there aren’t many trades happening there. It’s like speeding through an empty street as opposed to a crowded one. This void is created right after the price hits the mitigation block and then moves away from it, either up or down.
Now, the interesting part is that the market doesn’t like leaving these empty spaces unfilled. So, later on, the price often comes back to “fill” this void, covering about half of it. This return trip by the price to cover the empty space is what traders watch for. It’s like the price is making sure it hasn’t forgotten anything in that empty space before it continues on its journey.
The role of the mitigation block here is like a marker, showing where the price had trouble before. When the price comes back to fill the void, the point where the block happened serves as a reference, kind of like leaving a breadcrumb trail. Traders use this as a hint for a good place to enter or exit a trade, betting on the price’s movement as it fills the void.
Types of Mitigation Blocks
1. Bullish Mitigation Blocks
A bullish mitigation block occurs in the forex market when there’s an attempt to collect sell-side liquidity at a lower price, but it fails. This failure results in the price forming a higher low compared to the previous lows because it couldn’t push down further to gather more sell orders.
This scenario suggests that the buying pressure is starting to outweigh the selling pressure, indicating a potential upward trend. The price then moves up to fill a liquidity void that was created during this failed attempt, using a previously broken high as a reference point. This pullback and subsequent rise signal a good opportunity for traders to consider going long, expecting the price to continue its upward trajectory.
2. Bearish Mitigation Blocks
Conversely, a bearish mitigation block happens when the price attempts to push higher to collect buy-side liquidity but fails due to a lack of enough buyers at that level. As a result, the price drops, forming a lower high than the previous highs, indicating that selling pressure is beginning to dominate. After reaching this lower high, the price descends to fill the liquidity void left by the initial push, using a previously violated low as a reference.
This movement suggests a selling opportunity, as the price is expected to continue falling.
Breakers vs. Mitigation blocks
Comparing breakers and mitigation blocks helps traders spot different kinds of opportunities in the market. Let’s break down how they differ from each other in simple terms.
Breakers are about momentum. When the price in the market makes a strong move and creates a new high or low, that’s a breaker. It’s like when the price says, “I’m strong enough to push further,” and it does, gathering or releasing liquidity (buying or selling power) at those new points. A breaker shows that the market has enough energy to reach new heights or depths, collecting buy-side liquidity on new highs or sell-side liquidity on new lows.
Mitigation blocks, on the other hand, are about reversal or hesitation. They happen when the price tries to make a new high or low but can’t muster the strength to push through. It’s like the market saying, “I thought I could, but maybe not right now.” This failure to reach new levels indicates a potential change in direction or a pause in the trend. After hitting a mitigation block, the price often retraces, filling in the gap (liquidity void) it left when it tried and failed to break through.
How to trade the Breakers and Mitigation blocks?
Trading with mitigation blocks and breakers is about spotting the right moments to enter or exit the market based on what the price is telling us. Let’s simplify how to trade these patterns:
Trading Mitigation Blocks:
When you see a mitigation block, it means the price tried to push through to a new high or low but couldn’t. This is your clue that the market might be about to change direction.
- For a bullish mitigation block: If the price failed to go lower and started moving up, watch for it to fill up part of the gap it left behind. This could be a good time to think about buying, especially if the price reaches a point that used to be a low before it tried to drop.
- For a bearish mitigation block: If the price couldn’t reach a new high and begins to fall, look for it to cover some of the space it skipped on the way down. This might be a chance to sell, particularly if the price gets to a spot that was a high before it attempted to rise.
Trading Breakers:
Breakers show that the market has enough force to set new highs or lows. Here’s how you might trade these:
- For a bullish breaker: When the price makes a new high, it indicates strong buying interest. If the price then drops a bit but doesn’t fall too far before going back up, this pullback can be a buying opportunity, betting on the continuation of the uptrend.
- For a bearish breaker: If the price drops to a new low, showing strong selling pressure, and then rises slightly only to fall again, this slight rise could be your chance to sell, anticipating further declines.
In both strategies, using tools like Fibonacci retracement levels can help you find good entry points by showing where the price is likely to retrace to before continuing its move.
Adding confluences in trading?
Order flow, fair value gaps, and liquidity voids are all important concepts that can really help when you’re trading with mitigation blocks or breaker blocks. Let’s break down how each of these can add to your trading strategy:
Order Flow
Order flow is basically watching where the money is moving in the market. It gives you a hint about whether more people are buying or selling. When you’re looking at mitigation blocks or breakers, understanding order flow can tell you if there’s strong enough support for the price to continue in its new direction or if it’s likely to reverse. It’s like knowing which way the wind is blowing before you set sail.
Fair Value Gaps
Fair value gaps are areas where the price has moved quickly through, without much trading happening. These gaps show places where the price might return to, because markets tend to move back to areas where there hasn’t been much trading to “fill in” those gaps. When trading with mitigation blocks or breakers, spotting these gaps can help you predict where the price might head next, giving you good targets for entry or exit points.
Liquidity Voids
Liquidity voids are similar to fair value gaps. They’re created when the price skips over a range quickly, leaving a space where not much trading happened. The price is likely to come back to these areas to fill the void. By identifying liquidity voids near mitigation blocks or breakers, you can better anticipate the price’s next move. It’s like watching where a ball might bounce back after it’s skipped over a spot.
In essence, by combining these concepts with mitigation blocks or breaker blocks, you can get a clearer picture of the market’s movement.
Conclusion
Wrapping up, trading with mitigation blocks and breaker blocks can be a powerful strategy when you understand how to read the signs the market is giving you. By paying attention to order flow, fair value gaps, and liquidity voids, you’re essentially listening to the story of what’s happening in the market. Each of these elements offers clues about where the price might head next, helping you decide when to make your move.
Remember, order flow shows you the direction of the money movement, fair value gaps point out where the price might return to, and liquidity voids indicate areas the price is likely to revisit. Combining these insights with the signals from mitigation blocks and breaker blocks gives you a clearer roadmap for your trading journey.
By keeping these concepts in mind, you’re not just trading on guesses. You’re making informed decisions based on the market’s dynamics, aiming to place your trades where there’s a good chance of success. So, take the time to understand these patterns and indicators. With practice and patience, you’ll become more adept at spotting the right opportunities to enter or exit the market, enhancing your trading strategy for better results.

