Introduction
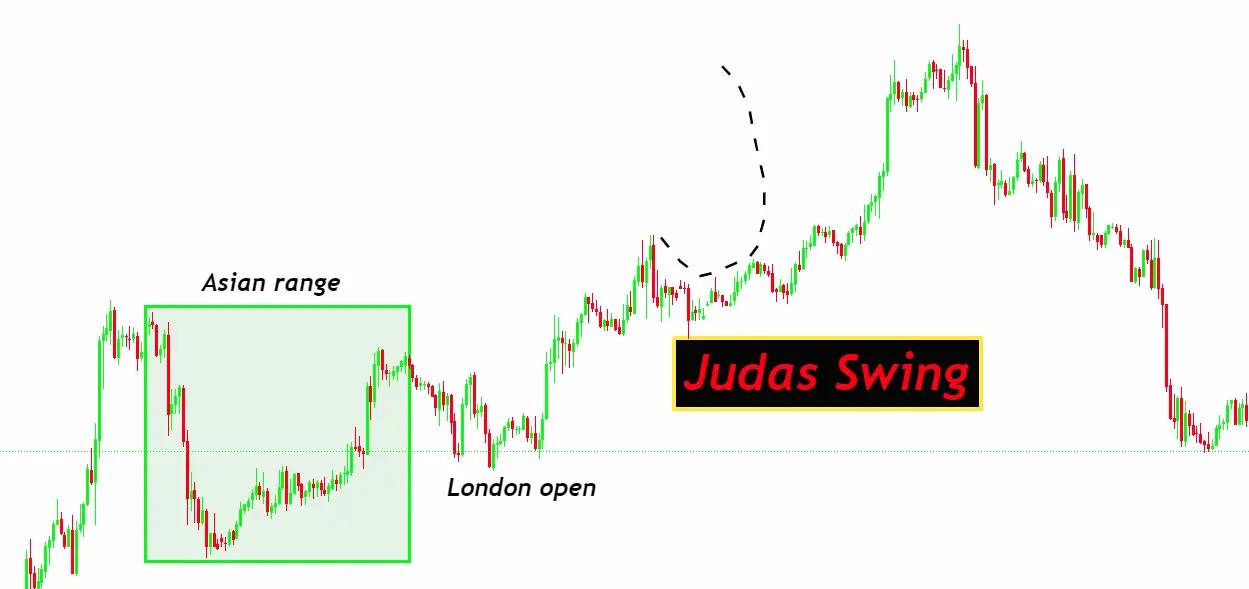
The Judas Swing, as named and utilized by ICT, is a pivotal concept for traders operating around the London Open. This strategy is based on the market maker’s ability to drive the price above or below the Asian session’s high or low, influenced by the institutional order flow bias. The essence of the Judas Swing lies in its deceitful nature; it lures traders into believing in a certain market direction only to abruptly reverse course. This reversal not only hits traders’ stop losses but can also completely exclude them from potential gains.
Named after the biblical figure known for his betrayal, the Judas Swing metaphorically represents how traders are led to believe in a false market direction before the true intentions are revealed, leaving them at a disadvantage. This maneuver occurs across all time frames, offering multiple opportunities each week, especially for those interested in scalping or day trading, with the 1-hour chart being particularly effective.
The hunt for the Judas Swing begins in the early hours, from midnight to 5:00 a.m. New York Time, a critical window for anticipating these deceptive price movements.
Main Characteristics of ICT Judas Swing
The ICT Judas Swing is characterized by a strategic maneuver in the Forex market, where market makers execute a false move during the London session, leading traders to believe in a continuation of price in one direction, only to sharply reverse it. This technique is designed to exploit the expectations of retail traders by creating a false sense of security before the market turns against them, akin to the betrayal by the biblical character Judas.
Key features of the ICT Judas Swing include:
- Timing: The prime window for the Judas Swing occurs between New York midnight and 5 AM New York Local Time, coinciding with the early hours of the London session. This period is critical for traders to observe potential Judas Swings as the market dynamics from the Asian session are taken advantage of.
- Market Manipulation: The Judas Swing is a prime example of market manipulation, where market makers rally or sell the price just above or below the Asian session’s highs or lows. This move is based on the current institutional order flow bias and is aimed at misleading traders about the market’s true direction.
- Trapping Traders: By moving the price to create a new high or low, market makers attract traders to follow this direction. However, as the Judas swing high or low is established, the price swiftly reverses. This sudden reversal can trigger stop losses and leave traders out of potential profitable moves, effectively trapping them in unfavorable positions.
- Application Across Time Frames: While the Judas Swing can occur across various time frames, it is most effective and frequently observed on the 1-hour chart. This makes it particularly suitable for scalping or day trading strategies, where traders can capitalize on these short-term market movements.
- Smart Money Trap: The term “Judas Swing” aptly describes this tactic as a smart money trap. It leverages the natural flow of the market, using the traders’ own expectations and strategies against them, leading to a false sense of market direction before executing a rapid and often unexpected reversal.
The London Judas Swing
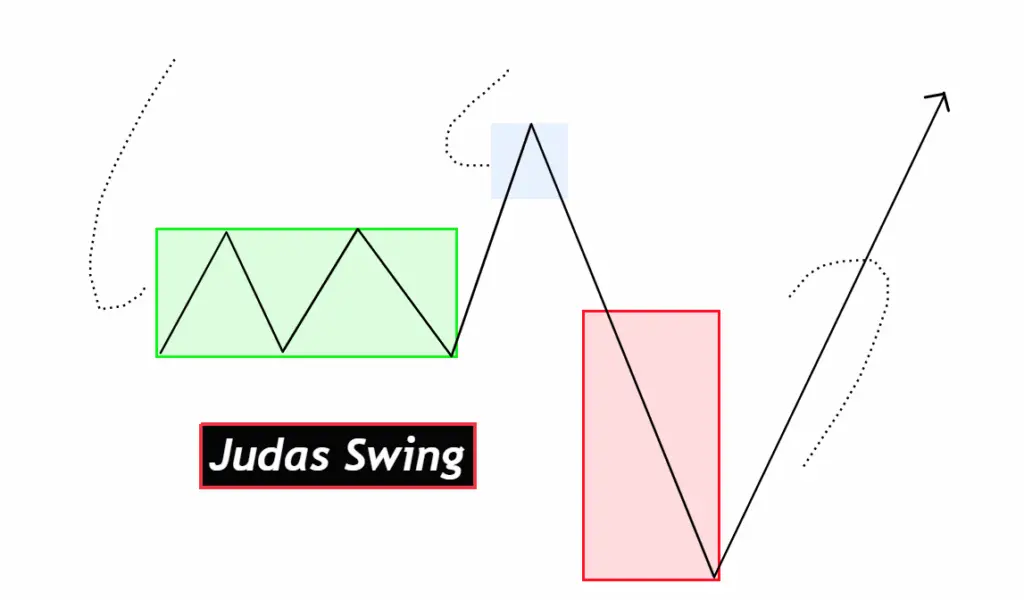
The London Judas Swing is a concept by ICT that refers to a false directional move in the market during the London session. This move is typically just above or below the highs or lows of the Asian session, aimed at misleading traders about the day’s true directional bias.
Bearish Scenario:
- Mark Highs and Lows of the Asia Session: Begin by identifying the highest and lowest price levels reached during the Asia session. These will serve as key markers for the next steps.
- Mark New York Midnight Candle Opening: Note the opening price of the candle at New York midnight (NY 00:00). This price level is crucial for the next phase of analysis.
- Check Price Trading Above New York Midnight: Observe the price action during the London Kill Zone, which starts with the London session and lasts until around 5:00 AM NY local time. If the price is trading above the New York midnight opening, it indicates a potential setup for a Judas Swing.
- Check for Liquidity Grab at Asian High: If the price is above the New York midnight opening during the London Kill Zone, look for a move that appears to grab liquidity at the Asian session high. This is a key sign of a potential bearish reversal.
- Identify Market Structure Shift: Watch for signs that indicate a shift in the market structure, suggesting a change in the market direction towards bearish.
- Find Favorable Entry (Fvg) Point: Based on the observed market structure shift and liquidity grab, identify a favorable entry point for a bearish trade.
- Set Target: Aim for the Asian session low or any visible sell-side liquidity as your target for a profitable bearish trade.
Bullish Scenario
- Identify the Opening Price of the New York Midnight Candle: Start by noting the opening price at New York midnight (NY 00:00). This price level is critical for assessing the initial market conditions leading into the London session.
- Monitor Price Action During the London Kill Zone: The London Kill Zone, typically the early hours of the London session until around 5:00 AM New York local time, is where you should focus. Check if the price is trading above the New York midnight opening. This is your first clue that a bullish Judas Swing could be forming.
- Look for a Liquidity Grab at the Asian Session Low: If the price during the London Kill Zone moves to or below the Asian session low, this could indicate a liquidity grab. Market makers might be attempting to shake out sellers and accumulate buy orders before reversing the price upward.
- Observe for Market Structure Shift (MSS): A clear change in market structure, such as forming a higher low or breaking past a previous resistance level, signals a potential shift to a bullish market. This change suggests that the initial downward move was indeed a Judas Swing, and a bullish reversal is underway.
- Determine Favorable Entry Point (FVG or IFVG): Based on the liquidity grab at the Asian session low and the subsequent market structure shift, identify a favorable entry point. This could be at a Fair Value Gap (FVG) or an Improved Fair Value Gap (IFVG), which aligns with the new bullish direction.
- Set Your Target: In a bullish scenario, your target should be set at the Asian session high or towards visible buy-side liquidity. This target represents where the market is likely to move post-reversal, allowing you to capitalize on the bullish momentum created by the Judas Swing.
By carefully following these steps, traders can identify and exploit the bullish opportunities presented by the London Judas Swing, aligning their trades with the true market direction anticipated after the deceptive initial move.
The New York Judas Swing
Trading the New York Judas Swing involves focusing on a specific time frame and price conditions to identify potential bearish scenarios. Here’s a simplified guide based on your content:
- Time Frame: The key period to watch is from 7:00 AM to 9:00 AM New York time, known as the New York Kill Zone. This window is crucial for observing the market’s behavior as it responds to the influx of trades and orders at the opening of the New York session.
- Price Condition: It’s important to confirm that the price is trading above the level it was at 7:00 AM and the New York opening price. This indicates that the market is initially moving in an upward direction, which is essential for setting up a New York Judas Swing scenario.
- Buy Side Liquidity Hunt: Wait for the market to make a move higher than the 7:00 AM level, which is likely to trigger buy orders. This hunt for buy-side liquidity is a setup by market makers to attract more buyers into the market, increasing the potential for a more impactful reversal.
- Market Structure Shift (MSS): Be on the lookout for any significant signs that the market direction might be changing, indicating a potential bearish shift. This could involve a reversal pattern or breaking below a key support level, suggesting that the initial upward move was deceptive.
- Favorable Entry (FVG or IFVG): After identifying a market structure shift, determine a strategic entry point for your trade. This could be a Fair Value Gap (FVG) or an Improved Fair Value Gap (IFVG) that aligns with the expected bearish movement.
- Target: Set your trading target towards sell-side liquidity or visible sell-side order clusters. This is where you anticipate the market will move after the Judas Swing has played out, allowing you to capitalize on the bearish reversal.
By following these steps, traders can navigate the New York Judas Swing.
Conclusion
The ICT Judas Swing, covering both the London and New York sessions, is a powerful concept that reveals how market makers manipulate price movements to their advantage, often at the expense of retail traders. By understanding how to identify and react to these Judas Swings, traders can better align their strategies with the true market dynamics, avoiding common pitfalls and enhancing their trading performance.
The bearish and bullish scenarios for the London Judas Swing, along with the specific approach for trading the New York Judas Swing, provide a structured framework for traders to follow. These strategies emphasize the importance of timing, price conditions, liquidity hunts, and market structure shifts in identifying potential trading opportunities.

